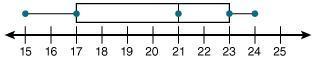
The graph below plots a function f(x):
if x represents time, the average rate of change...

Mathematics, 25.01.2020 05:31 nelsy7610
The graph below plots a function f(x):
if x represents time, the average rate of change of the function f(x) in the first three seconds is

Answers: 3


Another question on Mathematics
Mathematics, 21.06.2019 17:30
What is the range of the relation in the table below? x y –2 0 –1 2 0 4 1 2 2 0
Answers: 3
Mathematics, 21.06.2019 19:40
What happens to the area as the sliders are adjusted? what do you think the formula for the area of a triangle is divided by 2?
Answers: 1
You know the right answer?
Questions
Mathematics, 12.08.2020 05:01


History, 12.08.2020 05:01


Social Studies, 12.08.2020 05:01
English, 12.08.2020 05:01
History, 12.08.2020 05:01

Health, 12.08.2020 05:01
Biology, 12.08.2020 05:01
Mathematics, 12.08.2020 05:01


