
Mathematics, 30.01.2020 16:48 KaseyT
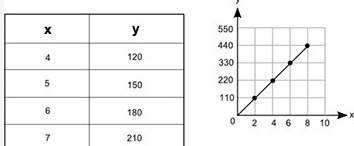
The table and the graph below each show a different relationship between the same two variables, x and y:
*insert attached picture here*
how much more would the value of y be on the graph than its value in the table when x = 12?
i added the y values for both until i got twelve and i subtracted the table's final y value from the graph's. i ended up with 410 but the only answer choices are:
150
300
450
600
what am i doing wrong?

Answers: 2


Another question on Mathematics
Mathematics, 21.06.2019 16:00
This race was first held in 1953 on august 16th. every decade the race finishes with a festival. how many years is this?
Answers: 2
Mathematics, 21.06.2019 16:30
The spring the owner of a sporting good store decreases the price of winter gloves from $10 to $8 each increases the price of swimming goggles from $8 to $10 without doing the math you think the percent decrease in the price of the gloves the same as the percent increase of the goggles explain why or why not
Answers: 1
Mathematics, 21.06.2019 23:50
What is the scale factor of two similar pyramids with volumes of 64 cubic feet and 8 cubic feet
Answers: 1
Mathematics, 22.06.2019 01:30
For the functions f(x) = -922 – 2x and g(x) = -32? + 6x – 9, find (f - g)(x) and (f - ).
Answers: 1
You know the right answer?
The table and the graph below each show a different relationship between the same two variables, x a...
Questions


History, 10.12.2020 04:50
History, 10.12.2020 04:50
Chemistry, 10.12.2020 04:50

Spanish, 10.12.2020 04:50
Mathematics, 10.12.2020 04:50
History, 10.12.2020 04:50

English, 10.12.2020 04:50
Mathematics, 10.12.2020 04:50
English, 10.12.2020 04:50
Mathematics, 10.12.2020 04:50

Biology, 10.12.2020 04:50


