

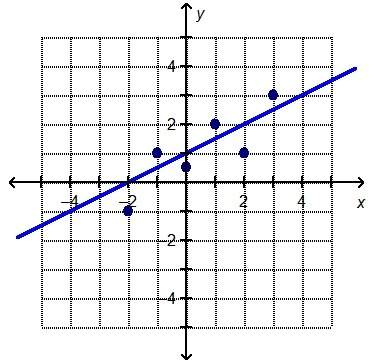
Consider the graph of the line of best fit, y = 0.5x + 1, and the given data points.
whi...

Mathematics, 11.10.2019 18:30 taylor5384
Consider the graph of the line of best fit, y = 0.5x + 1, and the given data points.
which is the residual value when x = 2?
a.–2
b.–1
c.1
d.2

Answers: 2


Another question on Mathematics
Mathematics, 21.06.2019 16:50
Which of the following points is collinear with (-2,1) and (0,3)
Answers: 3
Mathematics, 21.06.2019 18:00
Which statement about the relative areas of δabc and δxyz is true? the area of δabc > the area of δxyz the area of δabc < the area of δxyz the area of δabc = the area of δxyz more information is needed to compare.
Answers: 1
Mathematics, 21.06.2019 18:00
Look at arnold's attempt to solve the equation for b: 3b = 12 b = 3 · 12 b = 36 describe the mistake that arnold made.
Answers: 2
Mathematics, 21.06.2019 19:00
Quadrilateral abcd in the figure below represents a scaled-down model of a walkway around a historic site. quadrilateral efgh represents the actual walkway. abcd is similar to efgh. what is the total length, in feet of the actual walkway?
Answers: 2
You know the right answer?
Questions

Business, 18.07.2019 16:30

Biology, 18.07.2019 16:30


Physics, 18.07.2019 16:30
Mathematics, 18.07.2019 16:30
Mathematics, 18.07.2019 16:30


History, 18.07.2019 16:30

Physics, 18.07.2019 16:30
History, 18.07.2019 16:30
Mathematics, 18.07.2019 16:30
History, 18.07.2019 16:30


