
Mathematics, 28.01.2020 01:31 maggie123456751
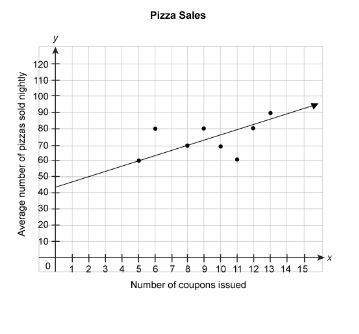
The scatter plot below shows the number of pizzas sold during weeks when different numbers of coupons were issued. the equation represents the linear model for this data.
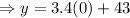
y = 3.4x + 43
according to the model, what is the average number of pizzas sold in one night if no coupons are issued?
a. 0
b. 21
c. 43
d. 60
e. 70

Answers: 2


Another question on Mathematics
Mathematics, 21.06.2019 14:00
If x = 12 and y = 3, what is the value of x - y 2? 81 6 3 18
Answers: 1
Mathematics, 21.06.2019 15:00
Pj is decorating pupcakes for rocky's birthday party. her color scheme is black, purple, and green. she will use this spinner to determine the color of sprinkles on each pupcake. which model shows the probability of randomly landing on each color?
Answers: 3
Mathematics, 21.06.2019 15:20
Can (3,5 and square root 34) be sides on a right triangle?
Answers: 1
Mathematics, 21.06.2019 15:20
Which is the equation of an ellipse with directrices at x = ±4 and foci at (2, 0) and (−2, 0)?
Answers: 3
You know the right answer?
The scatter plot below shows the number of pizzas sold during weeks when different numbers of coupon...
Questions

English, 18.12.2020 18:40

Mathematics, 18.12.2020 18:40
Mathematics, 18.12.2020 18:40

Physics, 18.12.2020 18:40
English, 18.12.2020 18:40

Mathematics, 18.12.2020 18:40

English, 18.12.2020 18:40
Mathematics, 18.12.2020 18:40


Arts, 18.12.2020 18:40
Arts, 18.12.2020 18:40


