The graph shows the water level in a bathtub, in inches, over time, t, in minutes.
for which...

Mathematics, 18.09.2019 00:30 loran55667
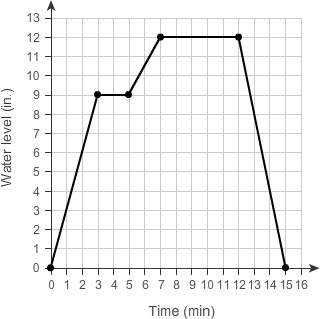
The graph shows the water level in a bathtub, in inches, over time, t, in minutes.
for which values of t (time) is the water level unchanging?
choose all answers that are correct.
a.
from t = 0 to t = 3
b.
from t = 3 to t = 5
c.
from t = 5 to t = 7
d.
from t = 7 to t = 12
e.
from t = 12 to t = 15

Answers: 2


Another question on Mathematics
Mathematics, 21.06.2019 16:00
Aheated piece of metal cools according to the function c(x) = (.5)x ? 7, where x is measured in hours. a device is added that aids in cooling according to the function h(x) = ? x ? 2. what will be the temperature of the metal after two hours?
Answers: 2
Mathematics, 21.06.2019 21:30
The price of a visit to the dentist is calculated according to the formula 50+100n50+100n where nn is the number of cavities the dentist finds. on your last visit to the dentist, 22 cavities were found. what was the cost of your visit?
Answers: 2
Mathematics, 21.06.2019 22:30
Which of the functions below could have created this graph?
Answers: 1
You know the right answer?
Questions

Mathematics, 10.04.2020 22:54

Geography, 10.04.2020 22:54
Mathematics, 10.04.2020 22:54
History, 10.04.2020 22:54
Mathematics, 10.04.2020 22:54
Mathematics, 10.04.2020 22:54

English, 10.04.2020 22:54

Mathematics, 10.04.2020 22:54

Mathematics, 10.04.2020 22:54

Mathematics, 10.04.2020 22:55
Mathematics, 10.04.2020 22:55


