
Mathematics, 25.08.2019 17:30 garasonmario
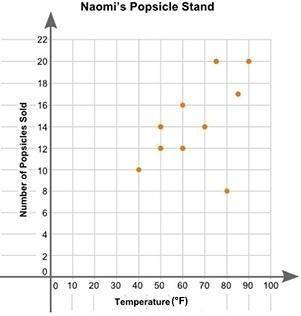
Naomi plotted the graph below to show the relationship between the temperature of her city and the number of popsicles she sold daily: part a: in your own words, describe the relationship between the temperature of the city and the number of popsicles sold. (2 points) part b: describe how you can make the line of best fit. write the approximate slope and y-intercept of the line of best fit. show your work, including the points that you use to calculate the slope and y-intercept. (3 points)

Answers: 1


Another question on Mathematics
You know the right answer?
Naomi plotted the graph below to show the relationship between the temperature of her city and the n...
Questions

Biology, 09.08.2019 17:20
Biology, 09.08.2019 17:20


History, 09.08.2019 17:20


