Me !
1.) the scatter plot shows the relationship between the number of car accidents i...

Mathematics, 31.01.2020 03:57 zhangyixing1
Me !
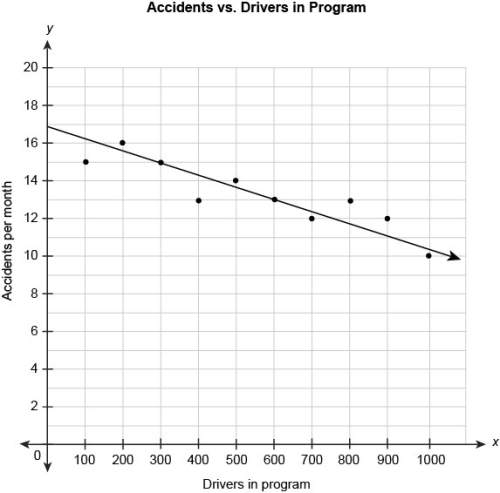
1.) the scatter plot shows the relationship between the number of car accidents in a month and the number of drivers attending a program on distracted driving. the equation represents the linear model for this data.
y=−0.0067x+17
what does the number -0.0067 in the equation mean in this context?
a. the number of accidents increased by 0.67 per month for every additional 100 drivers in the program.
b. there were 0.67 accidents per month.
c. the number of accidents was reduced by 0.67 per month for every additional 100 drivers in the program.
d. the number of accidents was reduced by 0.67 per month every month.
e. the number of accidents was reduced by 0.67 per month for every additional driver in the program.

Answers: 1


Another question on Mathematics
Mathematics, 21.06.2019 19:00
Astore has clearance items that have been marked down by 60%. they are having a sale, advertising an additional 55% off clearance items. what percent of the original price do you end up paying?
Answers: 1
Mathematics, 21.06.2019 20:00
Suppose a store sells an average of 80 cases of soda per day. assume that each case contains 24 cans of soda and that the store is open 10 hours per day. find the average number of soda that the store sells per hour.
Answers: 1
Mathematics, 21.06.2019 21:30
Scott’s bank account showed a balance of $750 on sunday. during the next five days, he made one deposit of $140 and numerous withdrawals of $180 each. let x represent the number of withdrawals that scott made. write an inequality that can be used to find the maximum number of withdrawals that scott could have made and maintain a balance of at least $100. do not use a dollar sign ($) in your response.
Answers: 1
Mathematics, 22.06.2019 00:10
Me i need ! find the asymptote and determine the end behavior of the function from the graph. the asymptote of the function is= blank 1 . for very high x-values,y =blank 2 options for blank 1 x=2 x=-2 x=3 x=-3 blank 2 options moves towards negative infinity moves toward the horizontal asymptote moves toward the vertical asymptote moves toward positive infinity
Answers: 1
You know the right answer?
Questions

English, 05.05.2020 18:43

Mathematics, 05.05.2020 18:43

History, 05.05.2020 18:43

Mathematics, 05.05.2020 18:43
Mathematics, 05.05.2020 18:43
English, 05.05.2020 18:44
Social Studies, 05.05.2020 18:44
Mathematics, 05.05.2020 18:44


