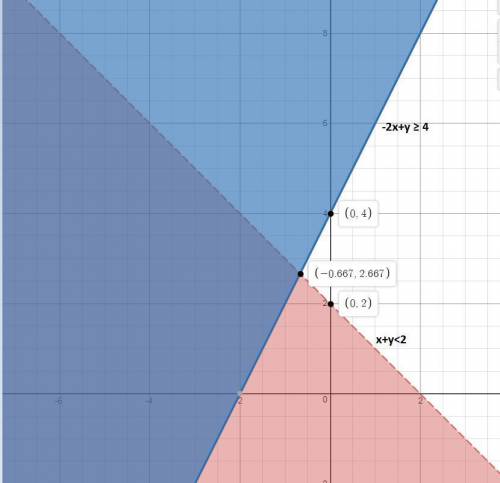
2. which of the following systems of inequalities represents the graph?
a. y ≤ 2x + 4
...

Mathematics, 20.09.2019 07:00 jeff568463
2. which of the following systems of inequalities represents the graph?
a. y ≤ 2x + 4
y ≥ –x + 2
b. 2x – y ≥ 4
y < –x + 2
c. y ≥ 2x + 4
–x + y ≤ 2
d.–2x + y ≥ 4
x + y < 2

Answers: 2


Another question on Mathematics
Mathematics, 21.06.2019 17:40
How can the correlation in the scatter plot graph below best be described? positive correlation negative correlation both positive and negative no correlation
Answers: 1
Mathematics, 21.06.2019 19:00
Solving systems of linear equations: tables represent two linear functions in a systemöwhat is the solution to this system? 0 (10)0 (1.6)0 18,26)0 18-22)
Answers: 1
Mathematics, 21.06.2019 21:40
Which of the following best describes the graph below? + + 2 + 3 + 4 1 o a. it is not a function. o b. it is a one-to-one function. o c. it is a many-to-one function. o d. it is a function, but it is not one-to-one.
Answers: 3
You know the right answer?
Questions


History, 23.09.2019 05:00
Mathematics, 23.09.2019 05:00


Mathematics, 23.09.2019 05:00

Chemistry, 23.09.2019 05:00
Biology, 23.09.2019 05:00
Mathematics, 23.09.2019 05:00
Mathematics, 23.09.2019 05:00
Mathematics, 23.09.2019 05:00

Mathematics, 23.09.2019 05:00


