The dot plots below show the scores for a group of students who took two rounds of a quiz:
w...

Mathematics, 29.08.2019 23:30 jjackson0010
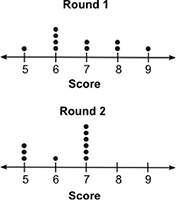
The dot plots below show the scores for a group of students who took two rounds of a quiz:
which of the following inferences can be made using the dot plot?
a. there is no overlap between the data.
b. round 1 scores were lower than round 2 scores.
c. round 2 scores were higher than round 1 scores.
d. the range of round 1 is greater than the round 2 range.

Answers: 1


Another question on Mathematics
Mathematics, 21.06.2019 17:00
The angle of a triangle are given as 6x,(x-3), and (3x+7). find x then find the measures of the angles
Answers: 2
Mathematics, 22.06.2019 00:30
Francisco's credit card has an apr of 28.98%, calculated on the previous monthly balance. his credit card record for the last 7 months is shown in the table below francisco is trying to figure out what this all means. answer the following questions: what is the total amount that francisco has paid in interest over the 7 months? what is the total amount that francisco has made in payments over the 7 months? how much of francisco's payments have gone to paying down the principal on his account? what is francisco's new balance at the end of month 8? what will francisco be charged for interest for month 8?
Answers: 2
Mathematics, 22.06.2019 01:30
Meee i honestly dont know what this question talking about
Answers: 3
Mathematics, 22.06.2019 03:00
The hockey team has been great! in 2008 they won 20% more games than in 2007. in 2009 they won 50% more games than in 2008. what was their overall percentage increase from 2007 through 2009?
Answers: 2
You know the right answer?
Questions


Mathematics, 06.04.2021 16:30
Mathematics, 06.04.2021 16:30

History, 06.04.2021 16:30

Mathematics, 06.04.2021 16:30
Chemistry, 06.04.2021 16:30


