


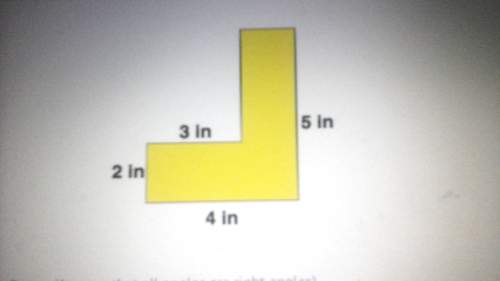
Find the area of the irregular figure . ( assume that all angles are right angles )
a) 10...

Mathematics, 09.10.2019 14:10 Dweath50
Find the area of the irregular figure . ( assume that all angles are right angles )
a) 10 in 2
b) 11 in 2
c) 13 in 2
d) 15 in 2

Answers: 2


Another question on Mathematics
Mathematics, 21.06.2019 14:30
An an average person has 6×10 by the power of two as many red blood cells as white blood cells a small sample of the blood has 7×10 by the power of three white blood cells about how many red blood cells are in the sample
Answers: 1
Mathematics, 21.06.2019 14:50
What is the volume of the sphere shown below with a radius of 3?
Answers: 1
Mathematics, 21.06.2019 16:00
Part one: measurements 1. measure your own height and arm span (from finger-tip to finger-tip) in inches. you will likely need some from a parent, guardian, or sibling to get accurate measurements. record your measurements on the "data record" document. use the "data record" to you complete part two of this project. name relationship to student x height in inches y arm span in inches archie dad 72 72 ginelle mom 65 66 sarah sister 64 65 meleah sister 66 3/4 67 rachel sister 53 1/2 53 emily auntie 66 1/2 66 hannah myself 66 1/2 69 part two: representation of data with plots 1. using graphing software of your choice, create a scatter plot of your data. predict the line of best fit, and sketch it on your graph. part three: the line of best fit include your scatter plot and the answers to the following questions in your word processing document 1. 1. which variable did you plot on the x-axis, and which variable did you plot on the y-axis? explain why you assigned the variables in that way. 2. write the equation of the line of best fit using the slope-intercept formula $y = mx + b$. show all your work, including the points used to determine the slope and how the equation was determined. 3. what does the slope of the line represent within the context of your graph? what does the y-intercept represent? 5. use the line of best fit to you to describe the data correlation.
Answers: 2
Mathematics, 21.06.2019 16:40
One of the inventors of integrated circuits observed that the number of transistors that fit on an integrated circuit will double every 24 months. what type of relationship most appropriately models this situation?
Answers: 3
You know the right answer?
Questions
Mathematics, 04.11.2020 21:00

Biology, 04.11.2020 21:00


Chemistry, 04.11.2020 21:00

Computers and Technology, 04.11.2020 21:00
English, 04.11.2020 21:00
Mathematics, 04.11.2020 21:00

History, 04.11.2020 21:00

Biology, 04.11.2020 21:00
History, 04.11.2020 21:00
Chemistry, 04.11.2020 21:00
Mathematics, 04.11.2020 21:00


