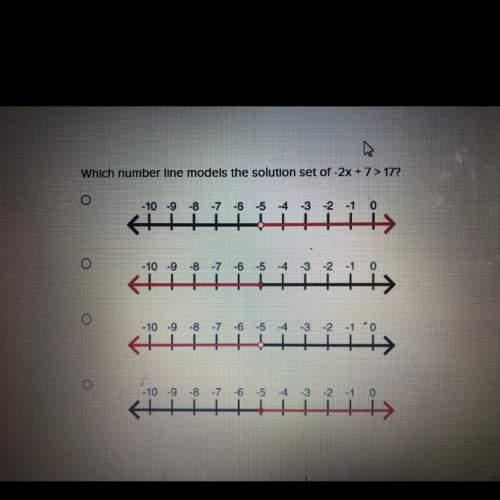
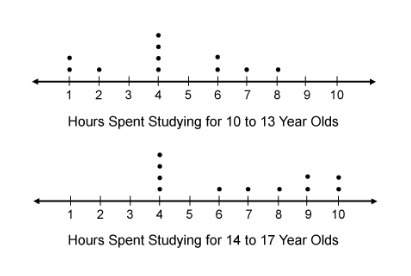
The line plots show the number of hours two groups of kids spent studying last weekend.
how do...

Mathematics, 02.09.2019 18:40 carma43
The line plots show the number of hours two groups of kids spent studying last weekend.
how does the data compare for the two groups of kids?
a: the 14- to 17-year olds spent more hours studying, on average, last weekend than the 10- to 13-year olds.
b: the median value for the hours spent studying last weekend for the 10- to 13-year olds is greater than the median value for the hours spent studying last weekend for the 14- to 17-year olds.
c: the 10- to 13-year olds spent an average of 6 hours studying last weekend.
d: the range for the hours spent studying last weekend for the 10- to 13-year olds is the same as the range for the hours spent studying last weekend for the 14- to 17-year olds.

Answers: 2


Another question on Mathematics
Mathematics, 20.06.2019 18:04
Given that anna wants to spend less than $60 for the subscription and only full month subscriptions are offered, what is the maximum number of months that ana can subscribe
Answers: 2
Mathematics, 21.06.2019 16:20
7.(03.01 lc)which set represents the range of the function shown? {(-1, 5), (2,8), (5, 3), 13, -4)} (5 points){-1, 2, 5, 13){(5, -1), (8, 2), (3,5), (-4, 13)){-4, 3, 5, 8}{-4, -1, 2, 3, 5, 5, 8, 13}
Answers: 3
Mathematics, 21.06.2019 20:50
What is the greatest number of parts of a circle that can be formed by cutting the circle with 7 straight cuts? (note: the parts do not have to be equal in size)
Answers: 3
Mathematics, 22.06.2019 01:30
Simplify 1/3 12x - 6 a. -2x-1 b.-2x-8 c.-x+4 d.3x+10 e. 4x-2
Answers: 1
You know the right answer?
Questions


Biology, 21.11.2020 02:00
Mathematics, 21.11.2020 02:00
Mathematics, 21.11.2020 02:00

Arts, 21.11.2020 02:00
Mathematics, 21.11.2020 02:00

Computers and Technology, 21.11.2020 02:00
Mathematics, 21.11.2020 02:00
Physics, 21.11.2020 02:00
Mathematics, 21.11.2020 02:00

Social Studies, 21.11.2020 02:00

English, 21.11.2020 02:00

Advanced Placement (AP), 21.11.2020 02:00


