
Mathematics, 01.10.2019 02:00 alyssanewsome
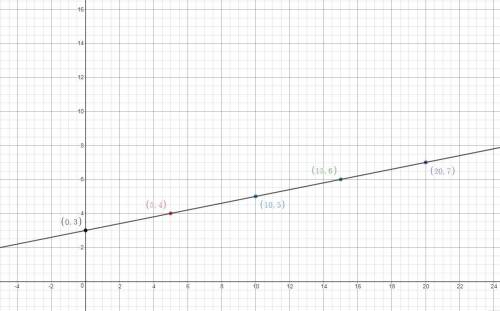
The graph below shows the distance, y, in miles, of a bird from its nest for a certain amount of time, x, in minutes: graph titled distance vs time is shown with time in minutes along the x-axis and distance from nest in miles along the y-axis. the scale on the x-axis shows the numbers 0 to 25 at increments of 5, and the scale on the y-axis shows the numbers 1 to 8 at increments of 1. a straight line joins the ordered pairs 0, 3 and 5, 4 and 10, 5 and 15, 6 and 20, 7. based on the graph, what is the initial value of the graph and what does it represent?

Answers: 2


Another question on Mathematics
Mathematics, 21.06.2019 17:00
The volume of a cube is 8 in to the 3rd power. how long is each side?
Answers: 1
Mathematics, 21.06.2019 20:00
Someone answer asap for ! the total ticket sales for a high school basketball game were $2,260. the ticket price for students were $2.25 less than the adult ticket price. the number of adult tickets sold was 230, and the number of student tickets sold was 180. what was the price of an adult ticket?
Answers: 1
Mathematics, 21.06.2019 23:30
Answer each of the questions for the following diagram: 1. what type of angles are these? 2. solve for x. what does x equal? 3. what is the measure of the angles?
Answers: 1
Mathematics, 21.06.2019 23:40
Klmn and pqrs are similar trapezoids. which side of pqrs corresponds to lm
Answers: 1
You know the right answer?
The graph below shows the distance, y, in miles, of a bird from its nest for a certain amount of tim...
Questions

History, 23.07.2021 17:10
Mathematics, 23.07.2021 17:10

Mathematics, 23.07.2021 17:10

Mathematics, 23.07.2021 17:10


Chemistry, 23.07.2021 17:10

Business, 23.07.2021 17:10

Social Studies, 23.07.2021 17:10


