
Mathematics, 03.02.2020 17:55 thawkins79
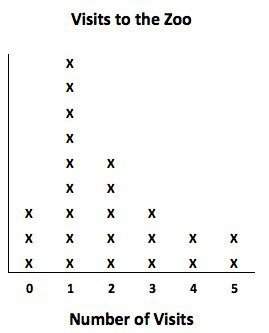
Joey asked all of his friends how many times they visited the zoo this year. the dot plot shown here displays the responses that joey recorded.
how many of joey's friends did not visit the zoo this year?
a) 2
b) 3
c) 4
d) 5

Answers: 3


Another question on Mathematics
Mathematics, 21.06.2019 13:30
Adaylily farm sells a portion of their daylilies and allows a portion to grow and divide. the recursive formula an=1.5(an-1)-100 represents the number of daylilies, a, after n years. after the fifth year, the farmers estimate they have 2225 daylilies. how many daylilies were on the farm after the first year?
Answers: 2
Mathematics, 21.06.2019 14:00
After applying the composition r0.90 ry to rs what are the coordinates of r' and s'? a.r'(–3, 1), s'(–3, 5)b.r'(–1, 3), s'(–5, 3)c.r'(1, 3), s'(5, 3)d.r'(5, 3), s'(1, 3)
Answers: 2
Mathematics, 21.06.2019 16:00
Part one: measurements 1. measure your own height and arm span (from finger-tip to finger-tip) in inches. you will likely need some from a parent, guardian, or sibling to get accurate measurements. record your measurements on the "data record" document. use the "data record" to you complete part two of this project. name relationship to student x height in inches y arm span in inches archie dad 72 72 ginelle mom 65 66 sarah sister 64 65 meleah sister 66 3/4 67 rachel sister 53 1/2 53 emily auntie 66 1/2 66 hannah myself 66 1/2 69 part two: representation of data with plots 1. using graphing software of your choice, create a scatter plot of your data. predict the line of best fit, and sketch it on your graph. part three: the line of best fit include your scatter plot and the answers to the following questions in your word processing document 1. 1. which variable did you plot on the x-axis, and which variable did you plot on the y-axis? explain why you assigned the variables in that way. 2. write the equation of the line of best fit using the slope-intercept formula $y = mx + b$. show all your work, including the points used to determine the slope and how the equation was determined. 3. what does the slope of the line represent within the context of your graph? what does the y-intercept represent? 5. use the line of best fit to you to describe the data correlation.
Answers: 2
Mathematics, 21.06.2019 20:30
Which coefficient matrix represents a system of linear equations that has a unique solution ? options in photo*
Answers: 1
You know the right answer?
Joey asked all of his friends how many times they visited the zoo this year. the dot plot shown here...
Questions


Social Studies, 03.11.2020 20:20

Computers and Technology, 03.11.2020 20:20

History, 03.11.2020 20:20
Engineering, 03.11.2020 20:20
Mathematics, 03.11.2020 20:20

Mathematics, 03.11.2020 20:20
Mathematics, 03.11.2020 20:20
Mathematics, 03.11.2020 20:20

English, 03.11.2020 20:20
Chemistry, 03.11.2020 20:20
History, 03.11.2020 20:20


