
Mathematics, 06.12.2019 16:31 haileybug0305
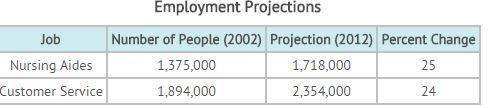
Employment projections job number of people (2002) projection (2012) percent change nursing aides 1,375,000 1,718,000 25 customer service 1,894,000 2,354,000 24 according to the chart for the projection of people in jobs in 2002 and ten years later, nursing aides had the larger percent of people added, but they added the smaller number of people. why is this true? a) the chart contains an error. b) nursing aides had more jobs added. c) nursing aides had more people in 2002. d) nursing aides had fewer people in 2002.

Answers: 3


Another question on Mathematics
Mathematics, 21.06.2019 20:30
You’re giving a cube with a length of 2.5 cm and a width of 2.5 cm and a high of 2.5 cm you place it on a scale and it is 295 g calculate the density
Answers: 1
Mathematics, 22.06.2019 00:40
Afootball quarterback has two more chances to throw a touchdown before his team is forced to punt the ball. he misses the receiver on the first throw 25% of the time. when his first throw is incomplete, he misses the receiver on the second throw 15% of the time. what is the probability of not throwing the ball to a receiver on either throw?
Answers: 2
You know the right answer?
Employment projections job number of people (2002) projection (2012) percent change nursing aides 1,...
Questions

History, 11.12.2020 05:10
Mathematics, 11.12.2020 05:10
Mathematics, 11.12.2020 05:10
Mathematics, 11.12.2020 05:10

Mathematics, 11.12.2020 05:10
Mathematics, 11.12.2020 05:10
Mathematics, 11.12.2020 05:10


English, 11.12.2020 05:10
Mathematics, 11.12.2020 05:10


