Mathematics, 31.12.2019 06:31 ahmadali89
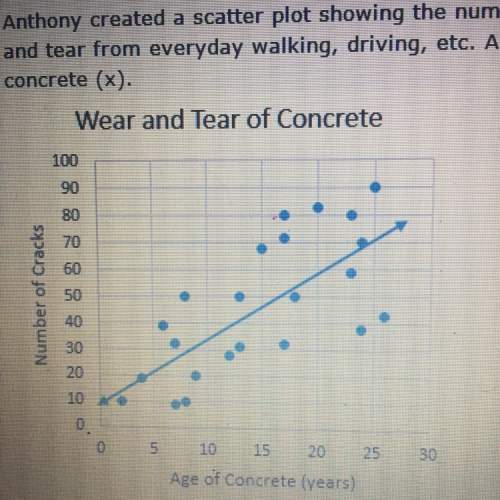
Anthony created a scatter plot showing the number of cracks in pieces of concrete that were poured during different wears and had received wear and tear from everyday walking, driving, etc. anthony's scatter plot shows the relationship between the number of cracks (y) and the age of the concrete (x).
based on the line of best fit, which is most likely the number of cracks that could be found in a piece of concrete that is 30 years old?
a) 87
b) 100
c) 74
d) 30


Answers: 2


Another question on Mathematics


Mathematics, 21.06.2019 21:30
50 plz, given the system of equations, match the following items. x + 3 y = 5 x - 3 y = -1 a) x-determinant b) y-determinant c) system determinant match the following to the pictures below.
Answers: 2

Mathematics, 21.06.2019 22:00
The birth weights of newborn babies in the unites states follow in a normal distrubution with a mean of 3.4 kg and standard deviation of 0.6 kg. reaserches interested in studying how. children gain weights decide to take random samples of 100 newborn babies and calculate the sample mean birth weights for each sample
Answers: 1

Mathematics, 22.06.2019 01:50
Felix wrote several equations and determined that only one of the equations has no solution. which of these equations has no solution?
Answers: 3
You know the right answer?
Anthony created a scatter plot showing the number of cracks in pieces of concrete that were poured d...
Questions


Social Studies, 05.05.2020 12:00


Biology, 05.05.2020 12:00


Mathematics, 05.05.2020 12:00


Advanced Placement (AP), 05.05.2020 12:00


History, 05.05.2020 12:00

Mathematics, 05.05.2020 12:00


