
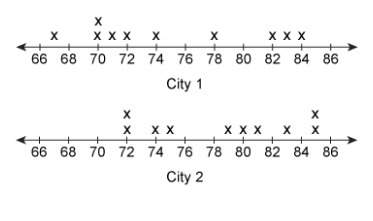
The line plot shows the daily high temperature in two cities over 10 days.
which conclus...

Mathematics, 08.10.2019 07:30 haileyrae187
The line plot shows the daily high temperature in two cities over 10 days.
which conclusion can be drawn from the data?
city 2 had less 80 degree days than city 1.
the weather is generally sunnier in city 2.
the variation in the daily high temperature is generally greater in city 1.
city 1 is generally much warmer than city 2.

Answers: 2


Another question on Mathematics
Mathematics, 21.06.2019 13:40
Which expression is equivalent to (4x^3*y^5)(3x^5*y)^2 \a) 24x^13*y^7b) 36x^13*y^7c) 36x^28*y^7d) 144x^16*y^12
Answers: 1
Mathematics, 21.06.2019 21:10
What is the measure of one interior angle of a pentagon
Answers: 2
Mathematics, 21.06.2019 21:30
Look at triangle wxy what is the length (in centimeters) of the side wy of the triangle?
Answers: 1
Mathematics, 22.06.2019 02:30
Will’s boss has asked him to compile the credit scores of everyone in his department. the data that will collected is shown in the table below. what is the mode of the credit scores in will’s department? (round to the nearest whole point, if applicable.) 634 667 644 892 627 821 857 703 654 a. 667 b. 722 c. 627 d. there is no mode in this group.
Answers: 1
You know the right answer?
Questions
Mathematics, 23.05.2021 01:00

Physics, 23.05.2021 01:00

Geography, 23.05.2021 01:00

Spanish, 23.05.2021 01:00


SAT, 23.05.2021 01:00
English, 23.05.2021 01:00

Chemistry, 23.05.2021 01:00
Chemistry, 23.05.2021 01:00
Business, 23.05.2021 01:00
Mathematics, 23.05.2021 01:00
Chemistry, 23.05.2021 01:00


