
Mathematics, 16.10.2019 18:30 sassycutie523
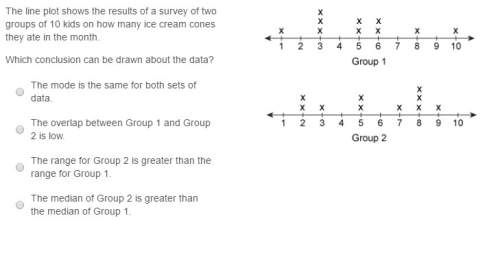
The line plot shows the results of a survey of two groups of 10 kids on how many ice cream cones they ate in the month.
which conclusion can be drawn about the data?

Answers: 2


Another question on Mathematics
Mathematics, 21.06.2019 22:00
How many solutions does the nonlinear system of equations graphed below have? a. one b. zero c. four d. two
Answers: 2
Mathematics, 21.06.2019 22:10
In which direction does the left side of the graph of this function point? f(x) = 3x3 - x2 + 4x - 2
Answers: 2
You know the right answer?
The line plot shows the results of a survey of two groups of 10 kids on how many ice cream cones the...
Questions

Social Studies, 18.07.2020 01:01

Computers and Technology, 18.07.2020 01:01
Mathematics, 18.07.2020 01:01
Mathematics, 18.07.2020 01:01


Mathematics, 18.07.2020 01:01
Mathematics, 18.07.2020 01:01


