
Mathematics, 30.09.2019 00:30 alexandra2442
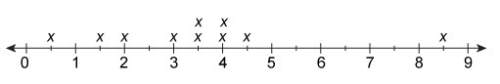
1) the line plot shows the weight gain, in pounds, of several dogs seen on monday by a veterinarian at the animal clinic. how many dogs gained fewer than 3 lb? the 1st picture is for the 1st question
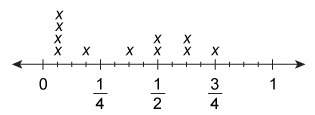
2) which has data value the highest frequency? the 2nd pic is for the 2nd question
1/16
3/16
3/8
5/8

Answers: 1


Another question on Mathematics
Mathematics, 21.06.2019 17:30
Apublic library wants to place 4 magazines and 9 books on each display shelf. the expression 4s+9s represents the total number of items that will be displayed on s shelves. simplify the expression
Answers: 2
Mathematics, 21.06.2019 19:00
How much orange juice do you need to make 2 servings of lemony orange slush?
Answers: 1
Mathematics, 21.06.2019 19:50
The graph shows the distance kerri drives on a trip. what is kerri's speed?
Answers: 3
Mathematics, 21.06.2019 22:00
Worth 100 points need the answers asap first row -x^2 2x^2 (x/2)^2 x^2 x is less than 2 x is greater than 2 x is less than or equal to 2 x is greater than or equal to 2 second row -5 -5/2 4 5 •2 is less than x& x is less than 4 •2 is less than or equal to x & x is less than or equal to 4 •2 is less than or equal to x& x is less than 4 •2 is less than x& x is less than or equal to 4
Answers: 2
You know the right answer?
1) the line plot shows the weight gain, in pounds, of several dogs seen on monday by a veterinarian...
Questions


Advanced Placement (AP), 03.08.2019 08:30


Biology, 03.08.2019 08:30


Computers and Technology, 03.08.2019 08:30
History, 03.08.2019 08:30
Computers and Technology, 03.08.2019 08:30

Chemistry, 03.08.2019 08:30
Social Studies, 03.08.2019 08:30


