
Mathematics, 29.10.2019 11:31 austinpace423
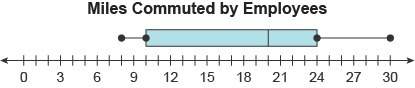
The box plot represents the number of miles employees at a bank commute to work in a week.
select all statements that are true for the data. so it can be more than one
a. about 75% of the employees commute between 10 mi and 30 mi a week.
b. the data above the median is more spread out than the data below the median.
c. the interquartile range is 14 mi.
d. about 25% of the employees commute between 8 mi and 10 mi a week.
e. the range is 14 mi.

Answers: 3


Another question on Mathematics
Mathematics, 21.06.2019 12:30
In djkl, side jk measures 10.6 inches, side kl measures 7 inches, and side jl measures 5 inches. based on the information that is provided, which could be a correct set of angle measures for these sides? angle j = 23.2°, angle k = 33.5°, angle l = 23.2° angle j = 23.2°, angle k = 33.5°, angle l = 123.2° angle j = 123.2°, angle k = 23.2°, angle l = 33.5° angle j = 33.5°, angle k = 23.2°, angle l = 123.2°
Answers: 1
Mathematics, 21.06.2019 13:10
The difference of 2 numbers is 21 and the quotient of the equation is 4 then what are the two numbers?
Answers: 2
Mathematics, 21.06.2019 14:40
Consider the table below. x y -1 -5 0 5 1 11 2 13 3 11 complete the standard form equation representing the quadratic relationship displayed above, where a, b, and c are constants.
Answers: 2
You know the right answer?
The box plot represents the number of miles employees at a bank commute to work in a week.
Questions

Mathematics, 10.12.2020 01:20
Mathematics, 10.12.2020 01:20


Physics, 10.12.2020 01:20

History, 10.12.2020 01:20
Mathematics, 10.12.2020 01:20
English, 10.12.2020 01:20


