What is the domain of the relation graphed below?
a. domain: {–5, –4, –3, –2, 0, 1, 2, 3, 4,...

Mathematics, 06.12.2019 16:31 kiekie1986
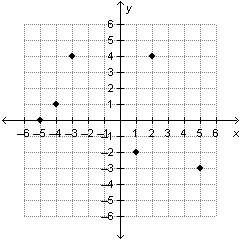
What is the domain of the relation graphed below?
a. domain: {–5, –4, –3, –2, 0, 1, 2, 3, 4, 5}
b. domain: {–3, –2, 0, 1, 4}
c. domain: {–5, –4, –3, 1, 2, 5}
d. domain: {(–5, 0), (–4, 1), (–3, 4), (1, –2), (2, 4), (5, –3)}

Answers: 3


Another question on Mathematics
Mathematics, 21.06.2019 16:00
The scatter plot graph shows the average annual income for a certain profession based on the number of years of experience which of the following is most likely to be the equation of the trend line for this set of data? a. i=5350e +37100 b. i=5350e-37100 c. i=5350e d. e=5350e+37100
Answers: 1
Mathematics, 21.06.2019 16:00
Data are collected to see how many ice-cream cones are sold at a ballpark in a week. day 1 is sunday and day 7 is the following saturday. use the data from the table to create a scatter plot.
Answers: 2
Mathematics, 21.06.2019 17:00
Need this asap if anyone can i would be very grateful. if you could show workings that would really
Answers: 1
Mathematics, 21.06.2019 18:00
The longer leg of a 30° 60° 90° triangle is 16 times square root of three how long is a shorter leg
Answers: 1
You know the right answer?
Questions

Mathematics, 09.01.2020 04:31
Mathematics, 09.01.2020 04:31

Computers and Technology, 09.01.2020 04:31

Social Studies, 09.01.2020 04:31
Mathematics, 09.01.2020 04:31

Social Studies, 09.01.2020 04:31


