 ÷
÷ =
= or 3.33 times likely
The diagram below represents three groups of students:
s (blue and green): the set of stude...

Mathematics, 26.10.2019 21:43 mandilynn22
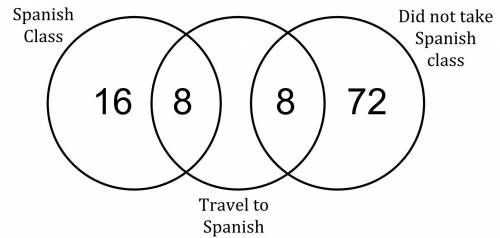
The diagram below represents three groups of students:
s (blue and green): the set of students who took a spanish class.
t (green and orange): the set of students who traveled to a spanish-speaking country.
d (red and orange): the set of students who did not take a spanish class. each block represents one student.
how many times more likely is it for a student who took spanish to have traveled to a spanish-speaking country than a student who did not take spanish?
a. it is 2.3 times as likely.
b. it is 3.3 times as likely.
c. it is 23 times as likely.
d. it is 30 times as likely.

Answers: 3


Another question on Mathematics
Mathematics, 21.06.2019 22:30
Acampus club held a bake sale as a fund raiser, selling coffee, muffins, and bacon and eggs sandwiches. the club members charged $1 for a cup of coffee, 3$ for a muffin , and $4 for a back. and egg sandwich. they sold a total of 55 items , easing $119. of the club members sold 5 more muffins than cups of coffee, how many bacon and egg sandwiches he’s did they sell
Answers: 1
You know the right answer?
Questions

Mathematics, 27.01.2021 21:30
Mathematics, 27.01.2021 21:30

Biology, 27.01.2021 21:30
Mathematics, 27.01.2021 21:30

Chemistry, 27.01.2021 21:30
Mathematics, 27.01.2021 21:30
Biology, 27.01.2021 21:30
Mathematics, 27.01.2021 21:30
Mathematics, 27.01.2021 21:30
Mathematics, 27.01.2021 21:30
Mathematics, 27.01.2021 21:30
SAT, 27.01.2021 21:30
Biology, 27.01.2021 21:30
Chemistry, 27.01.2021 21:30
Mathematics, 27.01.2021 21:30

Social Studies, 27.01.2021 21:30
Biology, 27.01.2021 21:30


