
Need asap
the graph shows the relationship between the number of months different students pr...

Mathematics, 05.10.2019 11:00 asiamuhammad6
Need asap
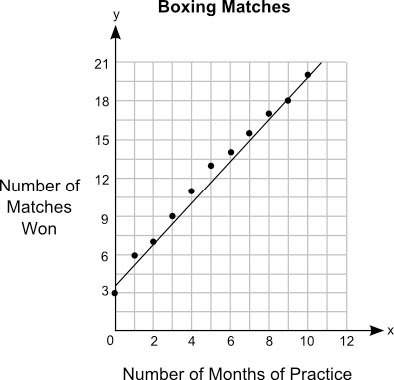
the graph shows the relationship between the number of months different students practiced boxing and the number of matches they won:
part a: what is the approximate y-intercept of the line of best fit and what does it represent? (5 points)
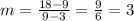
part b: write the equation for the line of best fit in the slope-intercept form and use it to predict the number of matches that could be won after 13 months of practice. show your work and include the points used to calculate the slope. (5 points)

Answers: 1


Another question on Mathematics
Mathematics, 21.06.2019 20:00
The scatterplot below shows the number of hours that students read weekly and the number of hours that they spend on chores weekly. which statement about the scatterplot is true?
Answers: 2
Mathematics, 21.06.2019 21:10
If f(x) = 6x – 4, what is f(x) when x = 8? a2 b16 c44 d52
Answers: 2
Mathematics, 21.06.2019 21:40
The sides of a parallelogram are 24cm and 16cm. the distance between the 24cm sides is 8 cm. find the distance between the 16cm sides
Answers: 3
You know the right answer?
Questions
Mathematics, 21.03.2020 10:05

Spanish, 21.03.2020 10:05


Computers and Technology, 21.03.2020 10:05

English, 21.03.2020 10:06

History, 21.03.2020 10:07
Business, 21.03.2020 10:07


