
Mathematics, 20.01.2020 10:31 pickelswolf3036
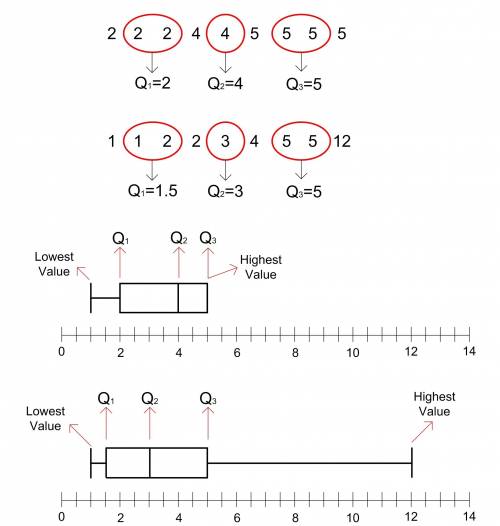
need plz the following table shows the number of hours some students in two neighborhoods spend walking to school each week: neighborhood a 5 2 4 2 5 5 4 5 2 neighborhood b 4 5 5 1 12 2 2 1 3 part a: create a five-number summary and calculate the interquartile range for the two sets of data. (6 points) part b: are the box plots symmetric? justify your answer. (4 points)

Answers: 1


Another question on Mathematics
Mathematics, 21.06.2019 15:10
Julia chooses a card at random from her set of cards. what is the probability that the card is labeled cat or hamster?
Answers: 2
Mathematics, 22.06.2019 01:30
If you were constructing a triangular frame, and you had wood in the length of 4 inches, 4 inches, and 7 inches, would it make a triangle? would you be able to create a frame from these pieces of wood?
Answers: 2
Mathematics, 22.06.2019 02:30
Mallory has been offers two different jobs. she can baby sit for 6 hours a week and get $8.50 an hour. or she can work at the library for 14 hours a week and make $5.50 an hour. which job will allow her to save the most money after 6weeks?
Answers: 1
You know the right answer?
need plz the following table shows the number of hours some students in two neighborhoods spend wa...
Questions

Health, 29.05.2020 23:11
Mathematics, 29.05.2020 23:11

English, 29.05.2020 23:11
Mathematics, 29.05.2020 23:11
Mathematics, 29.05.2020 23:11

Mathematics, 29.05.2020 23:11
Mathematics, 29.05.2020 23:11
English, 29.05.2020 23:11

Chemistry, 29.05.2020 23:11
Mathematics, 29.05.2020 23:11
Mathematics, 29.05.2020 23:11
History, 29.05.2020 23:11
History, 29.05.2020 23:11
History, 29.05.2020 23:11


