
Mathematics, 25.10.2019 12:43 dirgoperadiego2122
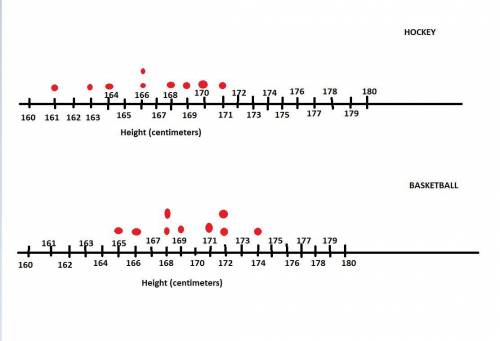
The dot plots below show the heights of some hockey players and some basketball players:
two dot plots are shown one below the other. the top and the bottom plots have the title hockey team players and basketball team players respectively. below the line for each dot plot is written height followed by centimeters in parentheses. the markings on each line are from 160 to 180 at intervals of 1. for the top plot there are two dots for 166 and 1 dot each for 161, 163, 164, 168, 169, 170, and 171. for the bottom plot there are 2 dots each for 168, 172, and 1 dot each for 165, 166, 169, 171, and 174.
based on visual inspection of the dot plots, which team appears to have the larger average height in centimeters?
the hockey team
the basketball team
both groups are similar
not enough information

Answers: 2


Another question on Mathematics
Mathematics, 22.06.2019 01:30
How do u write a function for the reflection across the y axis
Answers: 1
Mathematics, 22.06.2019 01:30
If the segment op is dilated by a scale factor r=2, what is the length of segment op? a)10cm b)16cm c)6cm d)4cm
Answers: 1
Mathematics, 22.06.2019 02:10
What is 4(x2 – 3x) + 12x2 + x simplified? f 4x2–3x h 16x2–11x g13x2–2x i16x2–12x
Answers: 1
You know the right answer?
The dot plots below show the heights of some hockey players and some basketball players:
Questions


Biology, 30.04.2021 09:00
Mathematics, 30.04.2021 09:00

Mathematics, 30.04.2021 09:00
Mathematics, 30.04.2021 09:00
Mathematics, 30.04.2021 09:00

Social Studies, 30.04.2021 09:00

Mathematics, 30.04.2021 09:00


Arts, 30.04.2021 09:00
Mathematics, 30.04.2021 09:00


