
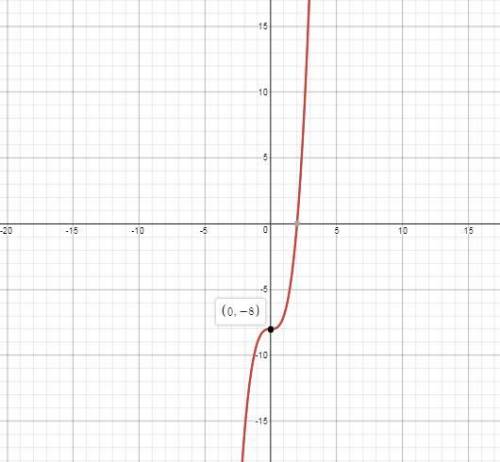

Which of the following describes the function x3 − 8?
a)the degree of the function is o...

Mathematics, 01.10.2019 23:30 skyemichellec
Which of the following describes the function x3 − 8?
a)the degree of the function is odd, so the ends of the graph continue in opposite directions. because the leading coefficient is positive, the left side of the graph continues down the coordinate plane and the right side continues upward.
b)the degree of the function is odd, so the ends of the graph continue in the same direction. because the leading coefficient is negative, the left side of the graph continues down the coordinate plane and the right side also continues downward.
c)the degree of the function is odd, so the ends of the graph continue in opposite directions. because the leading coefficient is negative, the left side of the graph continues up the coordinate plane and the right side continues downward.
d)the degree of the function is odd, so the ends of the graph continue in the same direction. because the leading coefficient is positive, the left side of the graph continues up the coordinate plane and the right side continues upward.

Answers: 2


Another question on Mathematics
Mathematics, 21.06.2019 22:30
What fraction is equivalent to 0.46464646··· a. 46⁄999 b. 46⁄100 c. 46⁄99 d. 23⁄50
Answers: 1
Mathematics, 21.06.2019 23:00
Each of the following data sets has a mean of x = 10. (i) 8 9 10 11 12 (ii) 7 9 10 11 13 (iii) 7 8 10 12 13 (a) without doing any computations, order the data sets according to increasing value of standard deviations. (i), (iii), (ii) (ii), (i), (iii) (iii), (i), (ii) (iii), (ii), (i) (i), (ii), (iii) (ii), (iii), (i) (b) why do you expect the difference in standard deviations between data sets (i) and (ii) to be greater than the difference in standard deviations between data sets (ii) and (iii)? hint: consider how much the data in the respective sets differ from the mean. the data change between data sets (i) and (ii) increased the squared difference îł(x - x)2 by more than data sets (ii) and (iii). the data change between data sets (ii) and (iii) increased the squared difference îł(x - x)2 by more than data sets (i) and (ii). the data change between data sets (i) and (ii) decreased the squared difference îł(x - x)2 by more than data sets (ii) and (iii). none of the above
Answers: 2
Mathematics, 22.06.2019 02:40
Exercise: counting committees 0.0/2.0 puntos (calificable) we start with a pool of n people. a chaired committee consists of k≥1 members, out of whom one member is designated as the chairperson. the expression k(nk) can be interpreted as the number of possible chaired committees with k members. this is because we have (nk) choices for the k members, and once the members are chosen, there are then k choices for the chairperson. thus, c=∑k=1nk(nk) is the total number of possible chaired committees of any size. find the value of c (as a function of n ) by thinking about a different way of forming a chaired committee: first choose the chairperson, then choose the other members of the committee. the answer is of the form c=(α+nβ)2γn+δ. what are the values of α , β , γ , and δ ?
Answers: 3
Mathematics, 22.06.2019 04:30
Apopulation of 1500 insects grows exponentially, by a factor of 3 every week. select all equations that represent or approximate the population, p, as a function of time in days, t, since the time it was 1500.
Answers: 2
You know the right answer?
Questions

Health, 01.12.2020 21:10

English, 01.12.2020 21:10
Mathematics, 01.12.2020 21:10

English, 01.12.2020 21:10
English, 01.12.2020 21:10
Mathematics, 01.12.2020 21:10

Geography, 01.12.2020 21:10
Mathematics, 01.12.2020 21:10

History, 01.12.2020 21:10
Mathematics, 01.12.2020 21:10
Mathematics, 01.12.2020 21:10

Advanced Placement (AP), 01.12.2020 21:10

World Languages, 01.12.2020 21:10

Mathematics, 01.12.2020 21:10


