Mathematics, 26.11.2019 13:31 amberchule9681
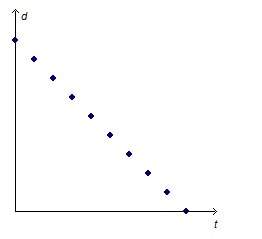
Agraph is drawn to represent a relationship between distance, d, and time, t. which situation could be represented on the graph?
- each point shows the distance, in feet, above the ground of a falling object after t seconds, where the falling speed increases as time increases.
- each point shows the distance, in feet, covered t seconds after a brake is applied, where the speed of the car decreases by a constant factor.
- each point shows the distance, in feet, traveled by an airplane on a runway by gradually increasing speed t seconds after being approved for takeoff.
- each point shows the remaining distance, in feet, to the finish line of a race t seconds after a runner begins the final stretch and runs at a constant speed.


Answers: 1


Another question on Mathematics

Mathematics, 21.06.2019 16:50
Which of the following points is collinear with (-2,1) and (0,3)
Answers: 3

Mathematics, 21.06.2019 17:00
Find the value of the variable and the length of each secant segment.
Answers: 1

Mathematics, 21.06.2019 18:30
Haruka hiked several kilometers in the morning. she hiked only 66 kilometers in the afternoon, which was 25% less than she had hiked in the morning. how many kilometers did haruka hike in all?
Answers: 3

Mathematics, 21.06.2019 20:00
Frank owns a $141,000 home, for which he has a 30-year mortgage in the amount of $700 a month. once he has paid off mortgage, how much will he have paid in investment? a. $111,000 b. $109,000 c. $120,000 d. $141,000
Answers: 1
You know the right answer?
Agraph is drawn to represent a relationship between distance, d, and time, t. which situation could...
Questions


Mathematics, 03.12.2020 03:40

Social Studies, 03.12.2020 03:40

Mathematics, 03.12.2020 03:40

Mathematics, 03.12.2020 03:40


Mathematics, 03.12.2020 03:40


Physics, 03.12.2020 03:40

Mathematics, 03.12.2020 03:40

Mathematics, 03.12.2020 03:40

English, 03.12.2020 03:40

Mathematics, 03.12.2020 03:40

Social Studies, 03.12.2020 03:40


Mathematics, 03.12.2020 03:40


