

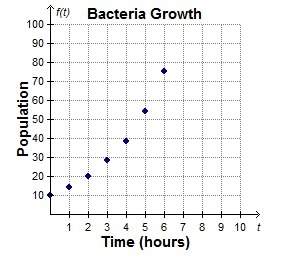
The graph shows the population of a bacteria in an experiment, measured every hour.
which fun...

Mathematics, 01.12.2019 09:31 carolinaleija12
The graph shows the population of a bacteria in an experiment, measured every hour.
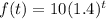
which function represents the population of the bacteria after t hours?
f(t) = 10(1.4)t
f(t) = 10(2.0)t
f(t) = 14(1.4)t
f(t) = 14(2.0)t

Answers: 3


Another question on Mathematics
Mathematics, 21.06.2019 13:30
Which statement holds true for absolute value functions? •the absolute value determines the direction in which theb.the coefficient determines the line along which the graph,the distance between the left and the right arm is based od.the vertex coordinates and the absolute value determine 111
Answers: 3
Mathematics, 21.06.2019 16:30
Problem fathi wants to print out a pdf document that is 48 pages long. to save paper, he decides to print on both sides of each sheet and to print two pages on each side of the sheet. how many sheets of paper will he need?
Answers: 3
Mathematics, 21.06.2019 20:10
In the diagram, the ratios of two pairs of corresponding sides are equal to prove that almn - axyz by the sas similarity theorem, it also needs to be shown that x 6 z un z zz un = 2x zləzz lezy
Answers: 1
Mathematics, 21.06.2019 21:30
This is a map of the mars exploration rover opportunity predicted landing site on mars. the scale is 1cm : 9.4km. what are the approximate measures of the actual length and width of the ellipse? i mostly need to know how to set it up : )
Answers: 3
You know the right answer?
Questions


Mathematics, 22.04.2020 03:30
English, 22.04.2020 03:30


Mathematics, 22.04.2020 03:30


Chemistry, 22.04.2020 03:30


