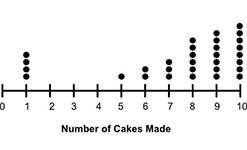
The dot plot below shows the number of cakes 31 chefs made in a week:
is the median or...

Mathematics, 16.11.2019 06:31 gunnatvinson
The dot plot below shows the number of cakes 31 chefs made in a week:
is the median or the mean a better center for this data and why?
mean; because the data is skewed and there are outliers
mean; because the data is symmetric and there are outliers
median; because the data is not skewed and there are outliers
median; because the data is not symmetric and there are outliers

Answers: 3


Another question on Mathematics
Mathematics, 21.06.2019 15:40
What is the probability of rolling a single die greater than 4
Answers: 1
Mathematics, 21.06.2019 16:00
Pick the expression that matches this description: a polynomial of the 5th degree with a leading coefficient of 7 and a constant term of 6 (choice a) 7x^5+2x^2+6 (choice b) 7x^6−6x^4+5 (choice c) 6x^7−x^5+5 (choice d) 6x^5+x^4+7
Answers: 2
Mathematics, 21.06.2019 17:30
10 ! in a race, nick is 50 feet in front of jay after ten seconds. how fast can nick run, if jay can run 20 feet per second?
Answers: 1
Mathematics, 21.06.2019 19:40
Afactory makes propeller drive shafts for ships. a quality assurance engineer at the factory needs to estimate the true mean length of the shafts. she randomly selects four drive shafts made at the factory, measures their lengths, and finds their sample mean to be 1000 mm. the lengths are known to follow a normal distribution whose standard deviation is 2 mm. calculate a 95% confidence interval for the true mean length of the shafts. input your answers for the margin of error, lower bound, and upper bound.
Answers: 3
You know the right answer?
Questions

English, 06.08.2021 16:10
Mathematics, 06.08.2021 16:10

English, 06.08.2021 16:10

Mathematics, 06.08.2021 16:10
English, 06.08.2021 16:10

Mathematics, 06.08.2021 16:10
History, 06.08.2021 16:10


