Picturewhich of the following equations describe the line shown below (-1,6) (2,-6)
...

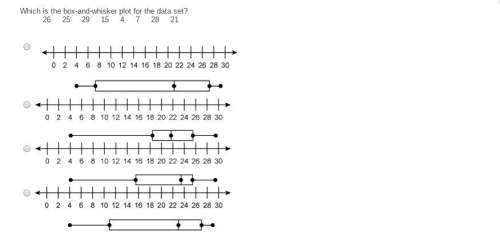
Mathematics, 26.09.2019 04:30 cool185635
Picturewhich of the following equations describe the line shown below (-1,6) (2,-6)
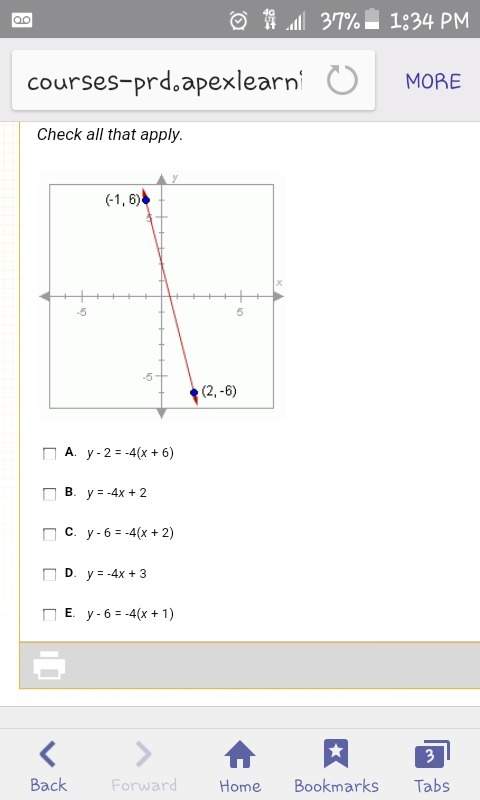

Answers: 1


Another question on Mathematics
Mathematics, 21.06.2019 16:00
Part one: measurements 1. measure your own height and arm span (from finger-tip to finger-tip) in inches. you will likely need some from a parent, guardian, or sibling to get accurate measurements. record your measurements on the "data record" document. use the "data record" to you complete part two of this project. name relationship to student x height in inches y arm span in inches archie dad 72 72 ginelle mom 65 66 sarah sister 64 65 meleah sister 66 3/4 67 rachel sister 53 1/2 53 emily auntie 66 1/2 66 hannah myself 66 1/2 69 part two: representation of data with plots 1. using graphing software of your choice, create a scatter plot of your data. predict the line of best fit, and sketch it on your graph. part three: the line of best fit include your scatter plot and the answers to the following questions in your word processing document 1. 1. which variable did you plot on the x-axis, and which variable did you plot on the y-axis? explain why you assigned the variables in that way. 2. write the equation of the line of best fit using the slope-intercept formula $y = mx + b$. show all your work, including the points used to determine the slope and how the equation was determined. 3. what does the slope of the line represent within the context of your graph? what does the y-intercept represent? 5. use the line of best fit to you to describe the data correlation.
Answers: 2
Mathematics, 21.06.2019 21:20
Which of the following can be used to explain a statement in a geometric proof?
Answers: 2
Mathematics, 21.06.2019 23:30
Determine if the following statement is true or false. the normal curve is symmetric about its​ mean, mu. choose the best answer below. a. the statement is false. the normal curve is not symmetric about its​ mean, because the mean is the balancing point of the graph of the distribution. the median is the point where​ 50% of the area under the distribution is to the left and​ 50% to the right.​ therefore, the normal curve could only be symmetric about its​ median, not about its mean. b. the statement is true. the normal curve is a symmetric distribution with one​ peak, which means the​ mean, median, and mode are all equal.​ therefore, the normal curve is symmetric about the​ mean, mu. c. the statement is false. the mean is the balancing point for the graph of a​ distribution, and​ therefore, it is impossible for any distribution to be symmetric about the mean. d. the statement is true. the mean is the balancing point for the graph of a​ distribution, and​ therefore, all distributions are symmetric about the mean.
Answers: 2
Mathematics, 21.06.2019 23:40
The frequency table shows the results of a survey asking people how many hours they spend online per week. on a piece of paper, draw a histogram to represent the data. then determine which answer choice matches the histogram you drew. in order here is the.. hours online: 0-3, 4-7, 8-11, 12-15, and 16-19. frequency: 5, 8, 10, 8, 7 answer for the question is in the picture! : )
Answers: 2
You know the right answer?
Questions


English, 03.07.2019 04:30

Biology, 03.07.2019 04:30

Mathematics, 03.07.2019 04:30
English, 03.07.2019 04:30

Mathematics, 03.07.2019 04:30


Social Studies, 03.07.2019 04:30
Mathematics, 03.07.2019 04:30
Biology, 03.07.2019 04:30


