

I'll fan
the graph below shows the height of a kicked soccer ball f(x), in feet, depending on...

Mathematics, 02.11.2019 23:31 joelpimentel
I'll fan
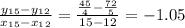
the graph below shows the height of a kicked soccer ball f(x), in feet, depending on the distance from the kicker x, in feet:
graph of quadratic function f of x having x intercepts at ordered pairs 0, 0 and 0, 20. the vertex is at 10, 15.
part a: what do the x-intercepts and maximum value of the graph represent? what are the intervals where the function is increasing and decreasing, and what do they represent about the distance and height? (6 points)
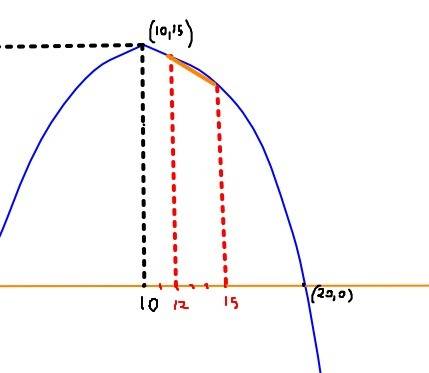
part b: what is an approximate average rate of change of the graph from x = 12 to x = 15, and what does this rate represent? (4 points)

Answers: 2


Another question on Mathematics
Mathematics, 21.06.2019 15:30
Acircular city park has a sidewalk directly through the middle that is 111 - feet long. if each bag of fertilizer covers 50 square feet, then determine how many bags of fertilizers the parks and recreation department needs to use to cover the circular park. ignore all the sidewalks around and through the park.
Answers: 1
Mathematics, 21.06.2019 18:30
Can someone me do math because i am having a breakdown rn because i don’t get it
Answers: 1
Mathematics, 21.06.2019 19:00
Witch represents the inverse of the function f(x)=1/4x-12
Answers: 1
Mathematics, 21.06.2019 19:30
Kendra had twice as much money as kareem. kendra later spent $8 and kareem earned $6. by then,the two had the same amount of money. how much money did each have originally?
Answers: 1
You know the right answer?
Questions

Mathematics, 07.06.2020 03:01
Mathematics, 07.06.2020 03:01


Mathematics, 07.06.2020 03:01
Mathematics, 07.06.2020 03:01
Health, 07.06.2020 03:01


