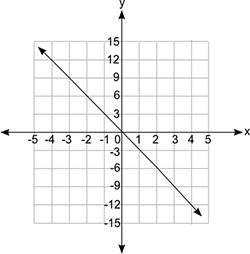
Which equation does the graph below represent?
a coordinate grid is shown. the x-axis v...

Mathematics, 07.10.2019 13:30 alizeleach0123
Which equation does the graph below represent?
a coordinate grid is shown. the x-axis values are from negative 5 to positive 5 in increments of 1 for each grid line, and the y-axis values are from negative 15 to positive 15 in increments of 3 for each grid line. a line is shown passing through the ordered pairs negative 4, 12 and 0, 0 and 4, negative 12.
y = fraction negative 1 over 3x
y = −3x
y = 3x
y = fraction 1 over 3x


Answers: 2


Another question on Mathematics


Mathematics, 21.06.2019 17:00
Asap i need it now choose all the answers that apply. sex-linked disorders affect males more than females affect females more than males can be carried by females, without being expressed are always expressed in males are caused by genes carried on the x and y chromosomes
Answers: 1

Mathematics, 21.06.2019 20:00
The midpoints of the sides of the large square are joined to form a smaller square. what is the area of the smaller square
Answers: 1

Mathematics, 21.06.2019 20:30
The frequency table shows the results of a survey comparing the number of beach towels sold for full price and at a discount during each of the three summer months. the store owner converts the frequency table to a conditional relative frequency table by row. which value should he use for x? round to the nearest hundredth. 0.89 0.90 0.92 0.96
Answers: 2
You know the right answer?
Questions


Computers and Technology, 22.10.2020 20:01


Mathematics, 22.10.2020 20:01


Mathematics, 22.10.2020 20:01

English, 22.10.2020 20:01


Mathematics, 22.10.2020 20:01

Mathematics, 22.10.2020 20:01

Chemistry, 22.10.2020 20:01

Mathematics, 22.10.2020 20:01


History, 22.10.2020 20:01


