
Mathematics, 30.10.2019 15:31 ethanw8973
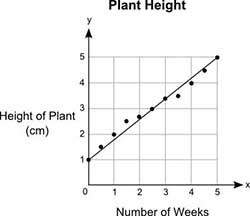
The graph shows the heights, y (in centimeters), of a plant after a certain number of weeks, x. donna drew the line of best fit on the graph.
what would most likely be the approximate height of the plant after 8 weeks?
11.0 centimeters
9.25 centimeters
8.8 centimeters
7.4 centimeters

Answers: 3


Another question on Mathematics
Mathematics, 21.06.2019 17:10
The average number of vehicles waiting in line to enter a parking lot can be modeled by the function f left parenthesis x right x squared over 2 left parenthesis 1 minus x right parenthesis endfraction , where x is a number between 0 and 1 known as the traffic intensity. find the rate of change of the number of vehicles waiting with respect to the traffic intensity for the intensities (a) xequals0.3 and (b) xequals0.6.
Answers: 1
Mathematics, 21.06.2019 17:30
Select the correct answer from the drop-down menu. subtracting 3xy^2 from 8xy^2 gives the same result as the expression. [tex]3xy ^{2} - 8xy ^{2} [/tex][tex] { - 7xy}^{2} - {2xy}^{2} [/tex][tex] {7xy}^{2} - {2xy}^{2} [/tex]
Answers: 3
You know the right answer?
The graph shows the heights, y (in centimeters), of a plant after a certain number of weeks, x. donn...
Questions

Mathematics, 15.10.2019 01:30


History, 15.10.2019 01:30
History, 15.10.2019 01:30


Arts, 15.10.2019 01:30

Chemistry, 15.10.2019 01:30
History, 15.10.2019 01:30
Chemistry, 15.10.2019 01:30
History, 15.10.2019 01:30

Computers and Technology, 15.10.2019 01:30
English, 15.10.2019 01:30
History, 15.10.2019 01:30


