
Mathematics, 17.11.2019 09:31 sarai47
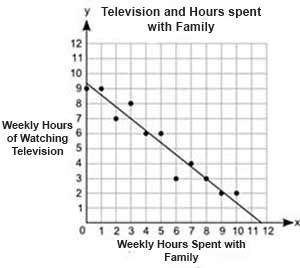
The scatter plot shows the relationship betweeen the number of hours students spend watching television and the numer of hours they spend with family each week.
what is the y-intercept of the line of best fit and what does it represent?
11.5 hours; the number of hours students spend with family in a week when they do not watch television
9.2 hours; the number of hours students watch television in a week when they do not spend time with family
9.2 hours; the number of hours students spend with family in a week when they do not watch television
11.5 hours; the number of hours students watch television in a week when they do not spend time with family

Answers: 1


Another question on Mathematics
Mathematics, 21.06.2019 12:30
Solve the inequality, then identify the graph of the solution. 2x – 1 > x + 2
Answers: 2
Mathematics, 21.06.2019 13:30
Drag and drop the answers into the boxes to complete this informal argument explaining how to derive the formula for the volume of a cone. since the volume of a cone is part of the volume of a cylinder with the same base and height, find the volume of a cylinder first. the base of a cylinder is a circle. the area of the base of a cylinder is , where r represents the radius. the volume of a cylinder can be described as slices of the base stacked upon each other. so, the volume of the cylinder can be found by multiplying the area of the circle by the height h of the cylinder. the volume of a cone is of the volume of a cylinder. therefore, the formula for the volume of a cone is 1/3 1/2 1/3πr^2h 1/2πr^2h πr^2h πr^2
Answers: 3
Mathematics, 21.06.2019 18:20
17. a researcher measures three variables, x, y, and z for each individual in a sample of n = 20. the pearson correlations for this sample are rxy = 0.6, rxz = 0.4, and ryz = 0.7. a. find the partial correlation between x and y, holding z constant. b. find the partial correlation between x and z, holding y constant. (hint: simply switch the labels for the variables y and z to correspond with the labels in the equation.) gravetter, frederick j. statistics for the behavioral sciences (p. 526). cengage learning. kindle edition.
Answers: 2
Mathematics, 21.06.2019 23:30
Simplify (8x2 − 1 + 2x3) − (7x3 − 3x2 + 1). −5x3 + 11x2 − 2 5x3 − 11x2 + 2 x3 + 2x2 + x3 x3 − 2x2 − x3
Answers: 1
You know the right answer?
The scatter plot shows the relationship betweeen the number of hours students spend watching televis...
Questions


Computers and Technology, 12.03.2020 20:17


English, 12.03.2020 20:18
Mathematics, 12.03.2020 20:18

Chemistry, 12.03.2020 20:18
Mathematics, 12.03.2020 20:18

History, 12.03.2020 20:18


