
Mathematics, 17.10.2019 19:00 garciagang0630
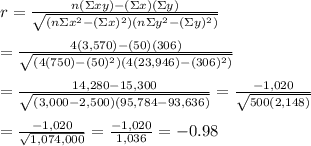
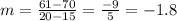
The table below shows the surface area y, in square feet, of a shrinking lake in x days: time (x) (days) 5 10 15 20 surface area (y) (square feet) 90 85 70 61 part a: what is the most likely value of the correlation coefficient of the data in the table? based on the correlation coefficient, describe the relationship between time and surface area of the lake. [choose the value of the correlation coefficient from −1, −0.98, −0.5, −0.02.] (4 points) part b: what is the value of the slope of the graph of surface area versus time between 15 and 20 days, and what does the slope represent? (3 points) part c: does the data in the table represent correlation or causation? explain your answer. (3 points)

Answers: 3
![\begin{center} \begin{tabular} {|c|c|c|c|c|} x & y & x^2 & y^2 & xy \\ [1ex] 5 & 90 & 25 & 8,100 & 450\\ 10 & 85 & 100 & 7,225 & 850\\ 15 & 70 & 225 & 4,900 & 1,050\\ 20 & 61 & 400 & 3,721 & 1,220\\ [1ex] \Sigma x=50 & \Sigma y=306 & \Sigma x^2=750 & \Sigma y^2=23,946 & \Sigma xy=3,570 \end{tabular} \end{center}](/tpl/images/0329/1081/d0719.png)
 and
and 


Another question on Mathematics
Mathematics, 21.06.2019 18:30
The base of a triangle exceeds the height by 9 inches. if the area is 180 square inches, find the length of the base and the height of the triangle.
Answers: 1
Mathematics, 22.06.2019 03:00
Describe how the presence of possible outliers might be identified on the following. (a) histograms gap between the first bar and the rest of bars or between the last bar and the rest of bars large group of bars to the left or right of a gap higher center bar than surrounding bars gap around the center of the histogram higher far left or right bar than surrounding bars (b) dotplots large gap around the center of the data large gap between data on the far left side or the far right side and the rest of the data large groups of data to the left or right of a gap large group of data in the center of the dotplot large group of data on the left or right of the dotplot (c) stem-and-leaf displays several empty stems in the center of the stem-and-leaf display large group of data in stems on one of the far sides of the stem-and-leaf display large group of data near a gap several empty stems after stem including the lowest values or before stem including the highest values large group of data in the center stems (d) box-and-whisker plots data within the fences placed at q1 â’ 1.5(iqr) and at q3 + 1.5(iqr) data beyond the fences placed at q1 â’ 2(iqr) and at q3 + 2(iqr) data within the fences placed at q1 â’ 2(iqr) and at q3 + 2(iqr) data beyond the fences placed at q1 â’ 1.5(iqr) and at q3 + 1.5(iqr) data beyond the fences placed at q1 â’ 1(iqr) and at q3 + 1(iqr)
Answers: 1
Mathematics, 22.06.2019 04:00
Maria has $11 to buy fish for her aquarium. each goldfish costs $2. how many goldfish can she buy? do not include units in your answer
Answers: 2
Mathematics, 22.06.2019 07:30
Which of the following statements about the function f (x) = sec(x) are true? select all that apply
Answers: 1
You know the right answer?
The table below shows the surface area y, in square feet, of a shrinking lake in x days: time (x) (...
Questions
Mathematics, 05.05.2020 11:40

Business, 05.05.2020 11:40
Mathematics, 05.05.2020 11:40


Mathematics, 05.05.2020 11:41
Geography, 05.05.2020 11:41
Mathematics, 05.05.2020 11:41

Mathematics, 05.05.2020 11:41


History, 05.05.2020 11:41
Mathematics, 05.05.2020 11:41


