
Mathematics, 24.01.2020 23:31 bairdmatthew43
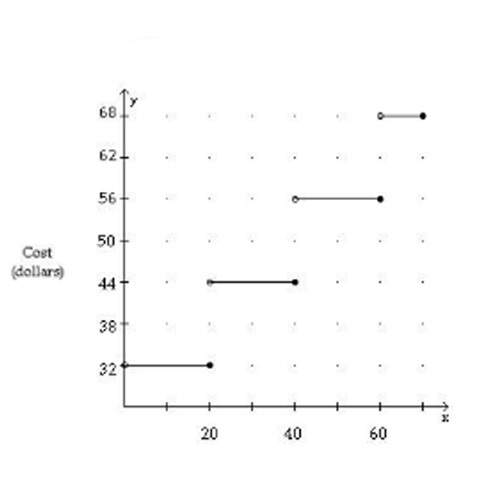
Graph included: hard limits are lim x--> 60- f(x) = 56; lim x--> 60+ f(x) = 68. what can you conclude about f(x)? how is this shown by the graph? the hard right and left limits are shown on the graph

Answers: 2


Another question on Mathematics
Mathematics, 21.06.2019 17:00
If a baby uses 15 diapers in 2 days how many diapers will the baby use in a year
Answers: 2
Mathematics, 21.06.2019 18:30
The median of a data set is the measure of center that is found by adding the data values and dividing the total by the number of data values that is the value that occurs with the greatest frequency that is the value midway between the maximum and minimum values in the original data set that is the middle value when the original data values are arranged in order of increasing (or decreasing) magnitude
Answers: 3
Mathematics, 21.06.2019 18:50
Which of the following values cannot be probabilities? 0.08, 5 divided by 3, startroot 2 endroot, negative 0.59, 1, 0, 1.44, 3 divided by 5 select all the values that cannot be probabilities. a. five thirds b. 1.44 c. 1 d. startroot 2 endroot e. three fifths f. 0.08 g. 0 h. negative 0.59
Answers: 2
Mathematics, 21.06.2019 19:30
Look at this pattern ; 1,4,9, number 10000 belongs in this pattern . what’s the place of this number?
Answers: 3
You know the right answer?
Graph included: hard limits are lim x--> 60- f(x) = 56; lim x--> 60+ f(x) = 68. what can y...
Questions


Chemistry, 25.06.2019 17:00

Health, 25.06.2019 17:00


Social Studies, 25.06.2019 17:00
Mathematics, 25.06.2019 17:00
Mathematics, 25.06.2019 17:00
Mathematics, 25.06.2019 17:00
Chemistry, 25.06.2019 17:00
Mathematics, 25.06.2019 17:00
English, 25.06.2019 17:00
Mathematics, 25.06.2019 17:00


