
Mathematics, 29.09.2019 10:30 sriggins1375
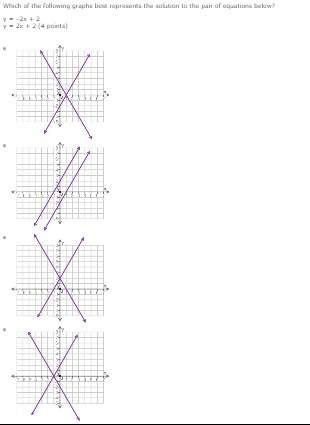
Which of the following graphs best represents the solution to the pair of equations below?
y = –2x + 2
y = 2x + 2 (4 points)
ps: graphs are attached

Answers: 2


Another question on Mathematics
Mathematics, 21.06.2019 16:30
Which choice represents the sample space ,s for this event
Answers: 3
Mathematics, 21.06.2019 18:00
Asquare has a perimeter of sixteen centimeters. what is the length of each of its sides? a. 8 cm c. 9 cm b. 4 cm d. 10 cm select the best answer from the choices
Answers: 2
Mathematics, 21.06.2019 20:00
The distribution of the amount of money spent by students for textbooks in a semester is approximately normal in shape with a mean of $235 and a standard deviation of $20. according to the standard deviation rule, how much did almost all (99.7%) of the students spend on textbooks in a semester?
Answers: 2
You know the right answer?
Which of the following graphs best represents the solution to the pair of equations below?
Questions

Mathematics, 27.02.2021 01:00


Geography, 27.02.2021 01:00

Spanish, 27.02.2021 01:00
Mathematics, 27.02.2021 01:00

Arts, 27.02.2021 01:00


Mathematics, 27.02.2021 01:00
History, 27.02.2021 01:00
Mathematics, 27.02.2021 01:00
History, 27.02.2021 01:00


