
Mathematics, 20.04.2021 19:10 pr47723
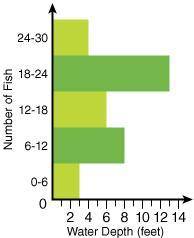
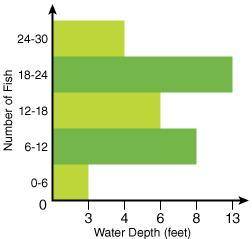
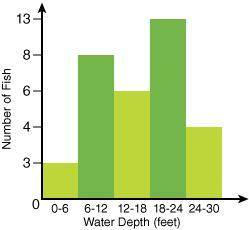
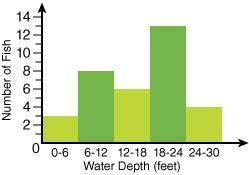
The chart below shows the number of fish caught at different water depths by a group of friends.
Water Depth (feet)_ Number of Fish 0-6
0-6 _3
6-12 _8
12-18 _6
18-24_ 13
24-30_ 4
Which histogram best represents this data?

Answers: 2


Another question on Mathematics
Mathematics, 21.06.2019 18:30
Savannah is painting a striped background for a mural on a wall that is 1515 yards long. she wants a total of 9696 stripes that are all the same width. which calculation should savannah use to decide how wide to make each stripe?
Answers: 3
Mathematics, 21.06.2019 21:00
Emily is entering a bicycle race for charity. her mother pledges $0.90 for every 0.75 mile she bikes. if emily bikes 18 miles, how much will her mother donate?
Answers: 1
Mathematics, 21.06.2019 23:00
Find the distance between the pair of points a(-1,8) and b(-8,4)
Answers: 1
You know the right answer?
The chart below shows the number of fish caught at different water depths by a group of friends.
W...
Questions

History, 10.10.2021 01:00


Law, 10.10.2021 01:00

Mathematics, 10.10.2021 01:00
Mathematics, 10.10.2021 01:00
Mathematics, 10.10.2021 01:00
History, 10.10.2021 01:00

Mathematics, 10.10.2021 01:00

Social Studies, 10.10.2021 01:00


