
Mathematics, 20.04.2021 21:30 bubl6010
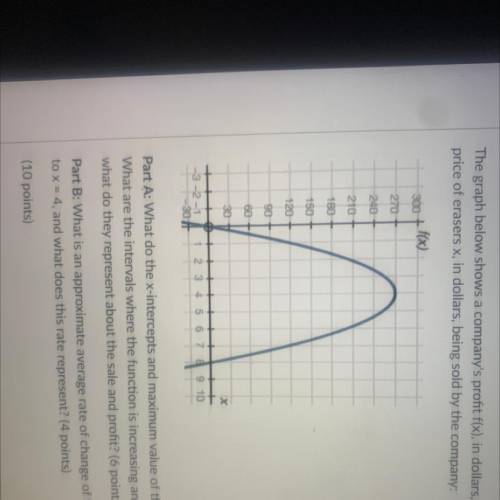
The graph below shows a company's profit f(x), in dollars, depending on the
price of erasers x, in dollars, being sold by the company:
300 + f(x)
270
240
210
180
150
120
90
60 +
30
Part A: What do the x-intercepts and maximum value of the graph represent?
What are the intervals where the function is increasing and decreasing, and
what do they represent about the sale and profit? (6 points)
Part B: What is an approximate average rate of change of the graph from x = 1
to x = 4, and what does this rate represent? (4 points)
(10 points)

Answers: 2


Another question on Mathematics
Mathematics, 21.06.2019 19:10
Labc is reflected across x = 1 and y = -3. what are the coordinates of the reflection image of a after both reflections?
Answers: 3
Mathematics, 21.06.2019 19:40
Which of the following could be the ratio of the length of the longer leg 30-60-90 triangle to the length of its hypotenuse? check all that apply. a. 313 6 b. 3: 215 c. 18: 13 d. 1: 13 e. 13: 2 of. 3: 15
Answers: 3
Mathematics, 21.06.2019 20:00
The diagram shows corresponding lengths in two similar figures. find the area of the smaller figure. a. 14.4 yd2 b. 24 yd2 c. 26.4 yd2 d. 28
Answers: 1
Mathematics, 21.06.2019 22:00
Manuela claims that and are congruent. which statement best describes her claim? she is incorrect because the segments do not have the same orientation. she is incorrect because the segments do not have the same length. she is correct because the segments have the same length. she is correct because the segments have the same orientation.
Answers: 1
You know the right answer?
The graph below shows a company's profit f(x), in dollars, depending on the
price of erasers x, in...
Questions
Mathematics, 22.01.2021 14:00
Mathematics, 22.01.2021 14:00


Chemistry, 22.01.2021 14:00
Mathematics, 22.01.2021 14:00
Mathematics, 22.01.2021 14:00

History, 22.01.2021 14:00

History, 22.01.2021 14:00

Chemistry, 22.01.2021 14:00


