
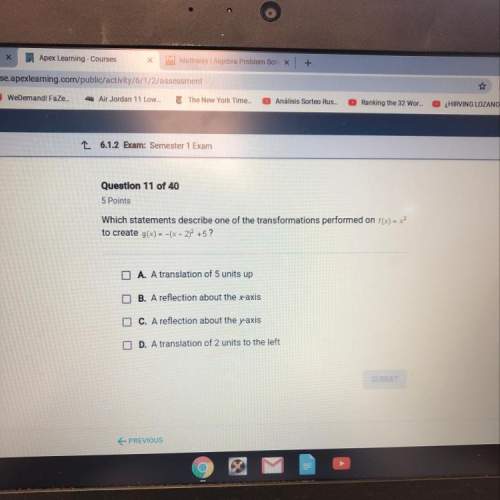
Mathematics, 20.04.2021 21:40 arielpraczko1
The graph below shows a company's profit f(x), in dollars, depending on the
price of erasers x, in dollars, being sold by the company:
300 + f(x)
270
240
210
180
150
120
90
60 +
30
Part A: What do the x-intercepts and maximum value of the graph represent?
What are the intervals where the function is increasing and decreasing, and
what do they represent about the sale and profit? (6 points)
Part B: What is an approximate average rate of change of the graph from x = 1
to x = 4, and what does this rate represent? (4 points)
(10 points)

Answers: 3


Another question on Mathematics
Mathematics, 21.06.2019 20:20
How do the number line graphs of the solutions sets of -23 > x and x-23 differ?
Answers: 1
Mathematics, 21.06.2019 21:30
Find the unit rate for: 75% high-fiber chimp food to 25% high -protein chimp food.
Answers: 2
Mathematics, 21.06.2019 22:30
When i'm with my factor 5, my prodect is 20 .when i'm with my addend 6' my sum is 10.what number am i
Answers: 1
Mathematics, 22.06.2019 00:00
If a suspect is in possession of 20 grams of cocaine how many ounces does he possess what will the charge be
Answers: 2
You know the right answer?
The graph below shows a company's profit f(x), in dollars, depending on the
price of erasers x, in...
Questions


Spanish, 07.05.2020 03:57
Mathematics, 07.05.2020 03:57
Mathematics, 07.05.2020 03:57

History, 07.05.2020 03:57

Computers and Technology, 07.05.2020 03:57

Social Studies, 07.05.2020 03:57
Computers and Technology, 07.05.2020 03:58
Mathematics, 07.05.2020 03:58


