
Mathematics, 21.04.2021 16:40 MorgannJ
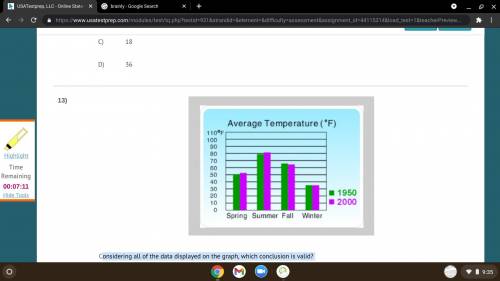
considering all of the data displayed on the graph, which conclusion is valid? A) No conclusion can be started from the data. B) The average temperatures for 1950 and 2000 were almost the same. C) The average temperature for 1950 was several degrees higher than for 2000. D) The average temperature for 2000 was several degrees higher than for 1950.

Answers: 1


Another question on Mathematics
Mathematics, 21.06.2019 14:30
You’re repairing a large rectangular aquarium. the final step is to cover the glass with a protective film. the front and back of the aquarium measure 4 meters by 2 meters, and the sides of the aquarium measure 3 meters by 2 meters. how many square meters of protective film do you need? ( )
Answers: 1
Mathematics, 21.06.2019 18:30
Logan wants to know how many skateboards have defective parts. he inspects 20,000 skateboards and keeps track of the number of defects per board. use his probability distribution table to find the expected value for defects on a skateboard.
Answers: 3
Mathematics, 21.06.2019 22:00
Write a description of each inequality. 1. -5a + 3 > 1 2. 27 - 2b < -6 (this < has a _ under it) 3. 1/2 (c + 1) > 5 (this > has a _ under it)
Answers: 3
Mathematics, 21.06.2019 22:00
Iknow its nothing to do with education, but what type of thing should i wrote here? ? : ) its for mcdonald's btw.
Answers: 1
You know the right answer?
considering all of the data displayed on the graph, which conclusion is valid? A) No conclusion can...
Questions

Computers and Technology, 17.07.2021 06:30

Chemistry, 17.07.2021 06:40


Biology, 17.07.2021 06:40
English, 17.07.2021 06:40
Mathematics, 17.07.2021 06:40

Social Studies, 17.07.2021 06:40
Mathematics, 17.07.2021 06:40
English, 17.07.2021 06:40
Mathematics, 17.07.2021 06:40
Mathematics, 17.07.2021 06:40
Mathematics, 17.07.2021 06:40
Biology, 17.07.2021 06:40


