
Mathematics, 21.04.2021 19:40 lasardia
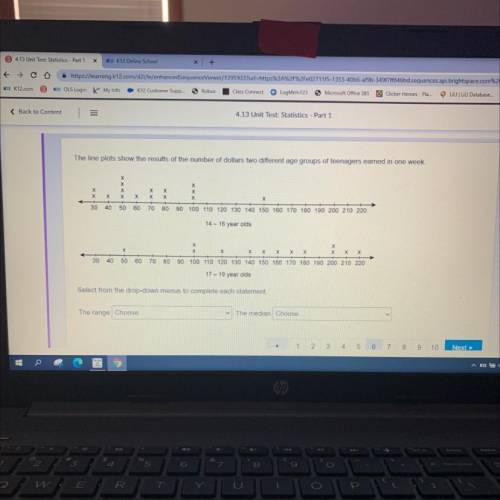
The line plots show the results of the number of dollars two different age groups of teenagers earned in one week.
X
X
х
X
х
х
х
X
X
X
30
40
50
60
70
80
90 100 110 120 130 140 150 160 170 180 190 200 210 220
14 - 16 year olds
х
х
X
х
х
х
X
х
х
X
X
X
30 40
50
60
70
80
90
100 110 120 130 140 150 160 170 180 190 200 210 220
17-19 year olds
Select from the drop-down menus to complete each statement
M.
The range Choose
✓ The median choose.
1
2 3 4 5 6 7
8 9
10

Answers: 1


Another question on Mathematics
Mathematics, 21.06.2019 14:00
Which of the following of the following sets of side lengths could not form a triangle?
Answers: 3
Mathematics, 21.06.2019 18:00
Each month, a shopkeeper spends 5x + 14 dollars on rent and electricity. if he spends 3x−5 dollars on rent, how much does he spend on electricity? for which value(s) of x is the amount the shopkeeper spends on electricity less than $100? explain how you found the value(s).
Answers: 2
Mathematics, 21.06.2019 18:00
Jacob signs up to work for 2 1/2 hours at the school carnival. if each work shift is 3/4 hour, how many shifts will jacob work? (i just want to double check : |, for anybody that responds! : )
Answers: 3
You know the right answer?
The line plots show the results of the number of dollars two different age groups of teenagers earne...
Questions

Mathematics, 15.06.2020 20:57

History, 15.06.2020 20:57
Mathematics, 15.06.2020 20:57


English, 15.06.2020 20:57
Mathematics, 15.06.2020 20:57
Mathematics, 15.06.2020 20:57
Mathematics, 15.06.2020 20:57

Mathematics, 15.06.2020 20:57
Mathematics, 15.06.2020 20:57
Mathematics, 15.06.2020 20:57

Mathematics, 15.06.2020 20:57
Mathematics, 15.06.2020 20:57


