
Mathematics, 21.04.2021 20:10 10040813
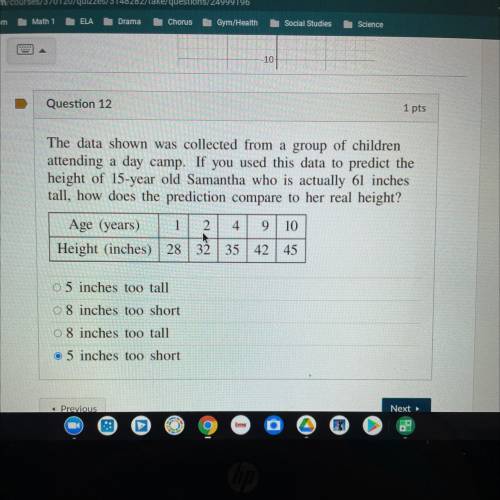
The data shown was collected from a group of children attending a day camp. If you used this data to predict the height of 15-year old Samantha who is actually 61 inches tall, how does the prediction compare to her real height?
Chart:
Age (years) 1 2 4
Height (in) 28 32 35
Age (years) 9 10
Height (in) 42 45

Answers: 1


Another question on Mathematics
Mathematics, 22.06.2019 06:00
An entertainment firm offer serveral dj choices and light shows that range in price based on the rental time period. the djs cost between $219 and $369 per night and the light shows cost between $159 and $309 per night. if you are booking both a dj and a light show write a compound inequality that represents the possible total amount you would pay x
Answers: 1
Mathematics, 22.06.2019 07:00
How to square the standard deviation? how do you get the bottom number so you can actually square it? for instance, 22/6 squared is 1.91, where did they get the 6 from?
Answers: 3
You know the right answer?
The data shown was collected from a group of children attending a day camp. If you used this data to...
Questions

Mathematics, 29.01.2020 20:02

Mathematics, 29.01.2020 20:02


English, 29.01.2020 20:02

Mathematics, 29.01.2020 20:02
English, 29.01.2020 20:02
Biology, 29.01.2020 20:02
History, 29.01.2020 20:02

Geography, 29.01.2020 20:02


