
Mathematics, 22.04.2021 16:30 itzandrea456
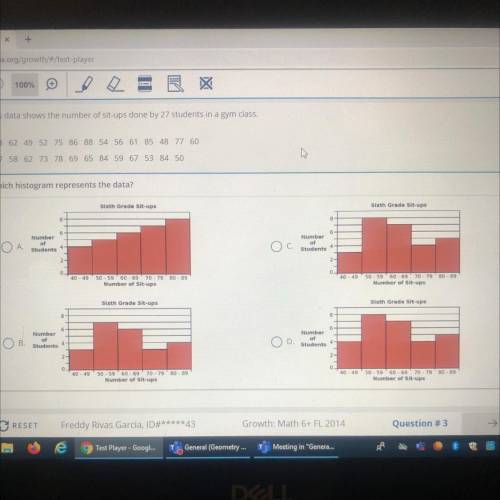
This data shows the number of sit-ups done by 27 students in a gym class.
58 62 49 52 75 86 88 54 56 61 85 48 77 60
47 58 62 73 78 69 65 84 59 67 53 84 50
Which histogram represents the data?

Answers: 1


Another question on Mathematics
Mathematics, 21.06.2019 13:00
How can we find the measure of an exterior angle if we know the measurement of an interior angle
Answers: 2
Mathematics, 21.06.2019 17:30
Which of the following is true about the graph of f(x)=7^x. select all that apply. a= it intercepts the x axis b=it intercepts both axis c=it intercepts neither d=it intercepts the y axis
Answers: 1
Mathematics, 21.06.2019 19:00
Billy plotted −3 4 and −1 4 on a number line to determine that −3 4 is smaller than −1 4 .is he correct? explain why or why not
Answers: 3
Mathematics, 21.06.2019 19:30
Each cookie sells for $0.50 sam spent $90 on baking supplies and each cookie cost $0.25 to make how many cookies does sam need to sell before making a profit formula: sales> cost
Answers: 1
You know the right answer?
This data shows the number of sit-ups done by 27 students in a gym class.
58 62 49 52 75 86 88 54...
Questions
Mathematics, 30.08.2019 03:00
Mathematics, 30.08.2019 03:00

Social Studies, 30.08.2019 03:00

History, 30.08.2019 03:00
Mathematics, 30.08.2019 03:00


Mathematics, 30.08.2019 03:00
Mathematics, 30.08.2019 03:00
Mathematics, 30.08.2019 03:00
Mathematics, 30.08.2019 03:00

English, 30.08.2019 03:00
Mathematics, 30.08.2019 03:00


