
Mathematics, 22.04.2021 20:00 jynaepooh
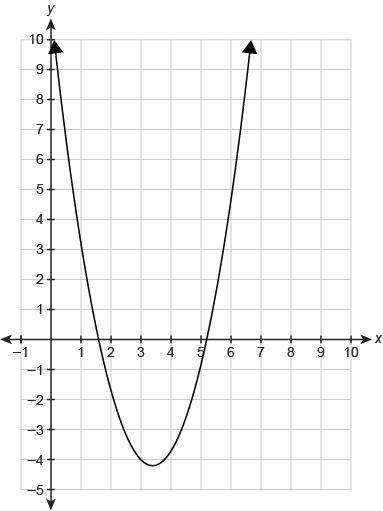
The graph shows the function f(x).
Which value is closest to the average rate of change from x = 1 to x = 3?
−3.5 - I know that this is the answer
−2.3 -
−2.3
−1.8
−0.3 -
i know that the answer is -3.5 but i need someone to explain the steps please

Answers: 3


Another question on Mathematics
Mathematics, 22.06.2019 02:00
The trapezoid is composed of a rectangle and two triangles. what is the area of the rectangle? what is the total area of the triangles? what is the area of the trapezoid? a) 48 cm2; 32 cm2; 80 cm 2 b) 48 cm2; 16 cm2; 64 cm 2 c) 128 cm2; 32 cm2; 160 cm 2 d) 128 cm2; 16 cm2; 144 cm 2
Answers: 1
Mathematics, 22.06.2019 04:30
The polynomial 2x3 + 9x2 + 4x - 15 represents the volume in cubic feet of a rectangular holding tank at a fish hatchery. the depth of the tank is (x – 1) feet. the length is 13 feet.
Answers: 2
Mathematics, 22.06.2019 04:30
There is a linear relationship between a salesperson sales and her weekly income.if her sales are $200 her income is $500 and if her sales are 1,200 her income is $600.what is the relationship between sales and income
Answers: 3
You know the right answer?
The graph shows the function f(x).
Which value is closest to the average rate of change from x = 1...
Questions
Mathematics, 05.03.2021 15:40

Spanish, 05.03.2021 15:40


Advanced Placement (AP), 05.03.2021 15:40

Computers and Technology, 05.03.2021 15:40
Spanish, 05.03.2021 15:40

English, 05.03.2021 15:40

Mathematics, 05.03.2021 15:40
Mathematics, 05.03.2021 15:40

Biology, 05.03.2021 15:40
Mathematics, 05.03.2021 15:40
Mathematics, 05.03.2021 15:40

Mathematics, 05.03.2021 15:40


