
Mathematics, 22.04.2021 22:40 kmart4062
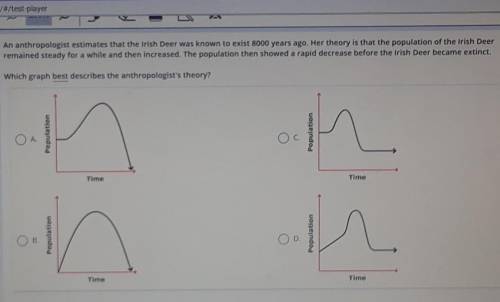
An anthropologist estimates that the Irish Deer was known to exist 8000 years ago. Her theory is that the population of the Irish Deer remained steady for a while and then increased. The population then showed a rapid decrease before the Irish Deer became extinct. Which graph best describes the anthropologist's theory? Population Population Time Time Population Population > Time Time

Answers: 3


Another question on Mathematics
Mathematics, 21.06.2019 15:00
Listed in the table is the percentage of students who chose each kind of juice at lunchtime. use the table to determine the measure of the central angle you would draw to represent orange juice in a circle graph
Answers: 3
Mathematics, 21.06.2019 16:10
The line containing the midpoints of the legs of right triangle abc where a(-5,5), b(1, 1), and c(3, 4) are the vertices.
Answers: 3
Mathematics, 21.06.2019 17:10
How many lines can be drawn through points j and k? 0 1 2 3
Answers: 2
You know the right answer?
An anthropologist estimates that the Irish Deer was known to exist 8000 years ago. Her theory is tha...
Questions


Computers and Technology, 15.04.2020 04:14
Mathematics, 15.04.2020 04:14


