
Mathematics, 23.04.2021 18:30 reagancunningham2004
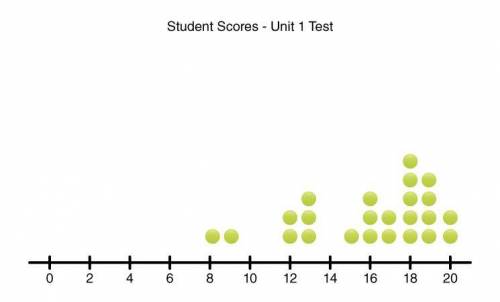
The following dot plot represents student scores on the Unit 1 math test. Scores are in whole number increments.
For this data set, the value of the range is about (Choose...) the value of the interquartile range.
On average, the data points lie between (Choose...) points from the mean.

Answers: 3


Another question on Mathematics
Mathematics, 21.06.2019 16:00
Abag has more green balls than blue balls, and there is at least one blue ball. let bb represent the number of blue balls and let gg represent the number of green balls. let's compare the expressions 2b2b and b + gb+g. which statement is correct? choose 1
Answers: 2
Mathematics, 21.06.2019 18:00
Question: a) does the given set of points represent a linear function? how do you know? b) assume that the point (-2,4) lies on the graph of a line. what y-values could complete this set of ordered pairs that lie on the same line: (- (hint: there are several correct answ
Answers: 2
Mathematics, 21.06.2019 20:00
Given: ∆mop p∆mop =12+4 3 m∠p = 90°, m∠m = 60° find: mp, mo
Answers: 1
Mathematics, 21.06.2019 23:20
The graph of y=x3 is transformed as shown in the graph below. which equation represents the transformed function?
Answers: 1
You know the right answer?
The following dot plot represents student scores on the Unit 1 math test. Scores are in whole number...
Questions


English, 29.06.2019 20:30


Computers and Technology, 29.06.2019 20:30


