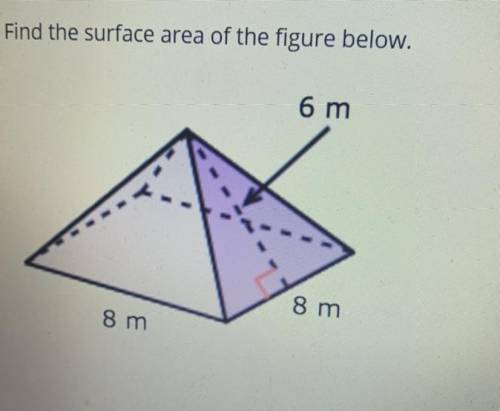
Find the surface area of the figure below.
6 m
8 m
8 m
Please help someone! I’m...

Mathematics, 23.04.2021 19:20 kimlyn58p0wyn0
Find the surface area of the figure below.
6 m
8 m
8 m
Please help someone! I’m struggling


Answers: 1


Another question on Mathematics

Mathematics, 21.06.2019 16:00
Asap for seven months an ice creams vendor collects data showing the number of cones sold a day (c) and the degrees above 70 degrees f the vendor finds that there is a positive linear association between c and t that is the best modeled by this equation c=3.7t+98 which statement is true? the model predicts that the average number of cones sold in a day is 3.7 the model predicts that the average number of cones sold i a day is 98 a model predicts that for each additional degree that the high temperature is above 70 degres f the total of number of cones sold increases by 3.7 the model predicts for each additional degree that the high temperature is above 70 degrees f the total number of cones sold increasingly by 98
Answers: 3

Mathematics, 21.06.2019 21:30
Iwill give brainliest. suppose tommy walks from his home at (0, 0) to the mall at (0, 5), and then walks to a movie theater at (6, 5). after leaving the theater tommy walks to the store at (6, 0) before returning home. if each grid square represents one block, how many blocks does he walk?
Answers: 2

Mathematics, 21.06.2019 22:00
In dire need~! describe how to use area models to find the quotient 2/3 divided by 1/5. check your work by also finding the quotient 2/3 divided by 1/5 using numerical operations only.
Answers: 1

Mathematics, 22.06.2019 04:00
Lab 1: central tendency and standard deviation directions: use excel to compute descriptive statistics. problem: you are the manger of a fast food store. part of your job is to report to the boss at the end of each day which special is selling best. use your knowledge of descriptive statistics and write one paragraph to let the boss know what happened today. here are the data. use excel to compute important values (mean, median, mode, and standard deviation). make sure to include a copy of your work. this should be submitted via canvas (no exceptions). make sure you include your excel work in addition to a summary of the results. special number sold cost huge burger 20 $2.95 baby burger 18 $1.49 chicken littles 25 $3.50 porker burger 19 $2.95 yummy burger 17 $1.99 coney dog 20 $1.99 total specials sold 119
Answers: 1
You know the right answer?
Questions


Mathematics, 21.09.2020 06:01


Mathematics, 21.09.2020 06:01


Social Studies, 21.09.2020 06:01

Biology, 21.09.2020 06:01


Mathematics, 21.09.2020 06:01

Mathematics, 21.09.2020 06:01


