These box plots show daily low temperatures for a sample of days in two
different towns.
Tow...

Mathematics, 24.04.2021 23:20 terryhgivens4294
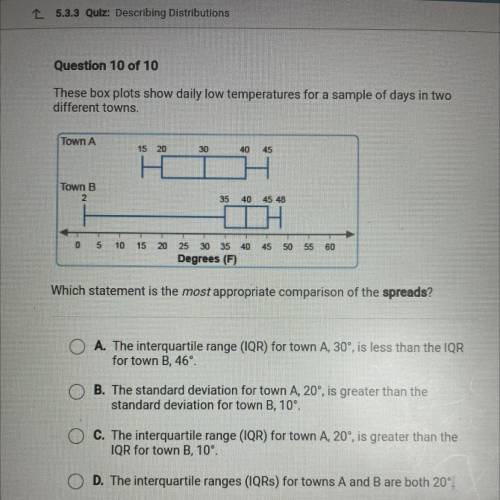
These box plots show daily low temperatures for a sample of days in two
different towns.
Town A
15 20
30
40
45
Town B
2
35
40 45 48
O
5
10
15 20
45
50
55
60
25 30 35 40
Degrees (F)
Which statement is the most appropriate comparison of the spreads?
O A. The interquartile range (IQR) for town A, 30°, is less than the IQR
for town B, 46º.
B. The standard deviation for town A, 20°, is greater than the
standard deviation for town B, 10'.
O C. The interquartile range (IQR) for town A, 20°, is greater than the
IQR for town B, 10°.
D. The interquartile ranges (IQRs) for towns A and B are both 20°.

Answers: 2


Another question on Mathematics
Mathematics, 21.06.2019 17:00
When you are making a circle graph by hand, how do you convert a number for a part into its corresponding angle measure in the circle graph? when you are making a circle graph by hand, what should you do if one of your angle measures is greater than 180°?
Answers: 2
Mathematics, 21.06.2019 17:00
Solve with work both bert and ernie received an increase in their weekly salaries. bert's salary increased from $520 to $520. ernie's salary went from $580 to $645. find the percent of increase for each salary. what was the larger of the two percents ?
Answers: 1
Mathematics, 21.06.2019 18:00
Identify which functions are linear or non-linear. a. f(x) = x2 + 1 b. f(x) = 2x + 5 c. f(x) = x 2 + 3 d. f(x) = 3 x + 7 e. f(x) = 4x + 10 2 - 5
Answers: 1
You know the right answer?
Questions

Computers and Technology, 20.11.2021 08:20
Mathematics, 20.11.2021 08:30

Arts, 20.11.2021 08:30

Social Studies, 20.11.2021 08:30

English, 20.11.2021 08:30


Mathematics, 20.11.2021 08:30
Mathematics, 20.11.2021 08:30
Biology, 20.11.2021 08:30

Mathematics, 20.11.2021 08:30


