subject
Mathematics, 25.04.2021 01:40 kingnya63

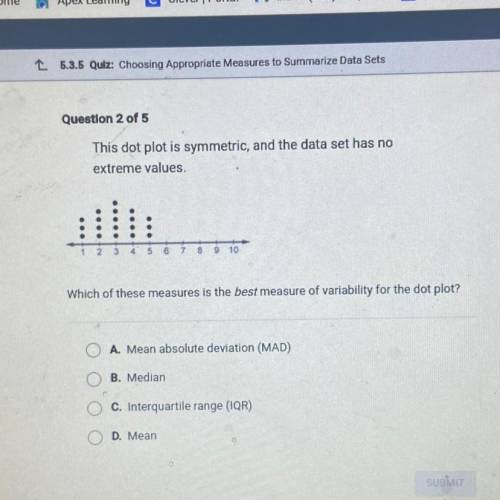
This dot plot is symmetric, and the data set has no extreme values.
2 3 4 5 6
9 10
Which of these measures is the best measure of variability for the dot plot?
A. Mean absolute deviation (MAD)
B. Median
OOO
C. Interquartile range (IQR)
D. Mean


This dot plot is symmetric, and the data set has no

extreme values.
2 3 4 5 6
9 10
Which of these

ansver
Answers: 3

Another question on Mathematics

question
Mathematics, 21.06.2019 14:30
Which system of linear inequalities is represented by the graph?
Answers: 2
question
Mathematics, 21.06.2019 15:10
Drag each sequence of transformations to the correct location on the table. classify the sequences of transformations based on whether or not they prove the congruency of the shapes by mapping shape i onto shape ii. plz i'll rate u 5 stars need this done for a mastery test
Answers: 1
question
Mathematics, 21.06.2019 19:30
Explain how you can find the missing fraction in 3 4/5 / (blank) 2 5/7. then find the missing fraction.
Answers: 2
question
Mathematics, 21.06.2019 19:30
Celeste wants to have her hair cut and permed and also go to lunch. she knows she will need $50. the perm cost twice as much as her haircut and she needs $5 for lunch. how much does the perm cost?
Answers: 1
You know the right answer?
This dot plot is symmetric, and the data set has no extreme values.
2 3 4 5 6
9 10
Questions
question
Arts, 21.07.2021 23:40
Questions on the website: 13722360