
Mathematics, 25.04.2021 02:20 yeimi12
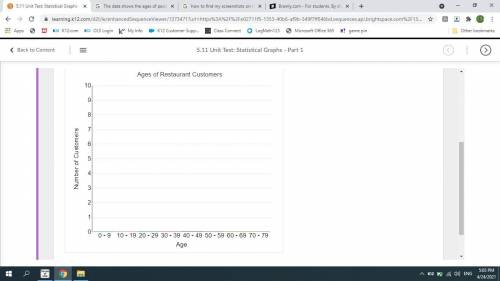
The data shows the ages of people in a restaurant.
20, 25, 5, 28, 66, 62, 21, 28, 34, 38, 40, 10, 12, 15, 45, 50, 28
Create a histogram of this data.
To create a histogram, hover over each age range on the x-axis. Then click and drag up to plot the data.

Answers: 3


Another question on Mathematics
Mathematics, 21.06.2019 15:30
Find the slope of the line below . enter your answer as a fraction or decimal. use a slash mark ( / ) as the fraction bar if necessary
Answers: 3
Mathematics, 21.06.2019 18:40
A33 gram sample of a substance that's used to detect explosives has a k-value of 0.1473. n = noekt no = initial mass (at time t = 0) n = mass at time t k = a positive constant that depends on the substance itself and on the units used to measure time t = time, in days
Answers: 1
Mathematics, 21.06.2019 19:20
Aefg - almn. find the ratio of aefg to almn. a)1: 4 b)1: 2 c)2.1 d)4: 1
Answers: 1
You know the right answer?
The data shows the ages of people in a restaurant.
20, 25, 5, 28, 66, 62, 21, 28, 34, 38, 40, 10,...
Questions

Spanish, 28.01.2021 01:00
Mathematics, 28.01.2021 01:00

Chemistry, 28.01.2021 01:00


Biology, 28.01.2021 01:00
Chemistry, 28.01.2021 01:00
Biology, 28.01.2021 01:00

Physics, 28.01.2021 01:00

Mathematics, 28.01.2021 01:00

World Languages, 28.01.2021 01:00
Mathematics, 28.01.2021 01:00


